


Prologue: Okay, So How Can Something This Useful Still Be a Bubble?
Let’s get the obvious part out of the way. AI works.
The models are useful. People are paying for them. Enterprises are stuffing them into software development, customer support, sales, finance, research, healthcare and basically anything else involving a keyboard. The revenue growth is ridiculous. The infrastructure spending is even more ridiculous. You can watch a coding agent complete an afternoon of work before lunch and understand immediately why every company on Earth wants some version of this.
So if we’re in an AI bubble, it isn’t because nobody wants the product. That’s the old argument, and it’s increasingly silly.
The much more interesting question is how an industry can have overwhelming demand, enormous revenue growth and some of the most useful products ever created while still becoming a bubble. That sounds contradictory until you separate the AI economy into two factories.
The first factory turns silicon, memory, electricity and a truly stupid amount of capital into machine intelligence. The second factory has to turn that intelligence back into customer revenue, gross profit, free cash flow and an acceptable return for everyone who financed the first one.
We’ve gotten extremely good at building the first factory. The entire market is now leaning on the assumption that this means the second one will work too, and, uh, that part is considerably less obvious.
To keep the numbers concrete, we’re going to build a fake but physically plausible AI cluster and call it Atlas, mostly because repeatedly saying “our hypothetical billion-dollar B200 project” gets annoying. Atlas contains 8,192 Nvidia B200 accelerators and costs $1 billion after including servers, networking, storage, power equipment, cooling, the building, commissioning and financing carry. A cloud provider operates it. A frontier lab supplies much of the expected demand. Private credit finances 60 percent of the installed cost. None of this is a claim about one real project. It’s a whiteboard model assembled from the public specifications, filings, contracts and market evidence we’ll use as we go.
Atlas has three clocks running at the same time:
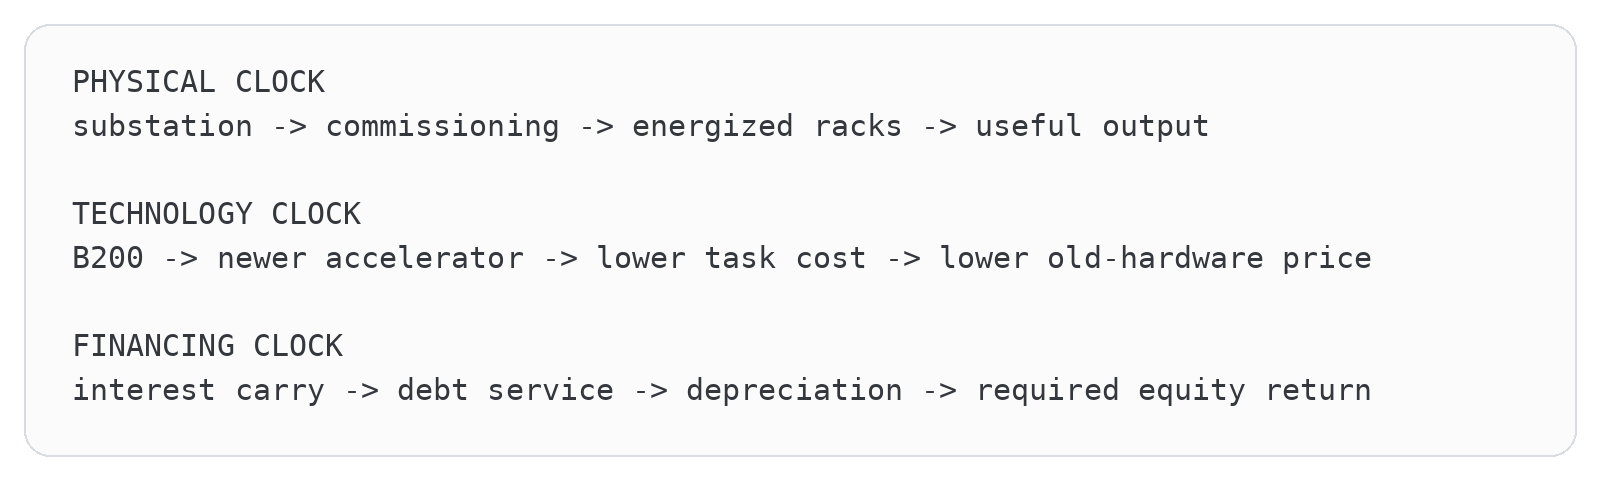
Here’s the weird part. Atlas doesn’t need AI to fail. Its lab customer can have millions of paying users. The models can keep improving. Every rack can eventually run at full power. The project can still disappoint its investors if construction finishes late, ordinary work moves to cheaper models, accelerator pricing falls or the hardware loses its premium economic life faster than the debt gets repaid.
That gives us the question at the center of this entire rabbit hole:
How can an industry have overwhelming demand and still be a bubble?
To answer it, we have to zoom all the way into one generated answer and then zoom all the way back out. We’ll start with memory traffic, batching and the cost of completing one useful task. Then we’ll follow the customer’s dollar through the lab, cloud provider, data center, semiconductor supply chain and lender. Finally, we’ll ask where the customer gets that dollar in the first place, because “AI spending” isn’t a source of money. It has to come from additional revenue, higher prices, lower costs or somebody’s payroll.
That last step is where the whole story eventually lands. Cost savings can finance AI adoption for a while. Labor savings can finance it for even longer because an eliminated salary is a recurring annual saving. But neither pool grows forever. A company can avoid the same hire only once, and it can’t reduce exposed payroll below zero. If laboratories, cloud providers, data centers, chipmakers, utilities and lenders all expect their AI revenue to keep compounding after the easiest costs have been removed, the broader market eventually has to put more dollars into customers’ bank accounts. Existing companies must sell more, new companies must form, prices must rise without destroying demand or entirely new markets must appear.
Labor savings can finance the bridge. Revenue expansion has to finance the destination.
The dot-com bubble was largely a bet that internet demand would arrive faster than it actually did. The dot-AI bubble may have almost the opposite problem. Demand is already here. The unanswered question is whether intelligence can be manufactured cheaply enough, sold at a high enough price and converted into enough customer value to repay the factory built around it.
The dot-com bubble overestimated how quickly demand would arrive. The dot-AI bubble may be overestimating how profitably that demand can be served.
Part I: What Does Intelligence Cost to Produce?
Chapter 1: The Two Factories
The opening distinction becomes more useful if we make it concrete. Imagine two companies standing beside two enormous factories.
The first factory produces websites in 1999. It has already purchased servers, leased fiber and hired a small army of people who use the word “eyeballs” as though it’s a financial metric. The factory can make websites. That part works. Its problem is that relatively few people are online, even fewer are comfortable spending money there, and almost nobody knows which website will eventually become a real business.
The factory has production capacity waiting for demand. Now imagine a second factory producing AI intelligence. It’s 2026. Hundreds of millions of people already use the product. Developers leave coding agents running while they sleep. Enterprises feed customer-support tickets, financial documents, sales calls and internal codebases into models. The problem isn’t persuading anyone that generated intelligence might be useful.
The problem is that every unit of output requires the factory to turn on again. That gives us two very different diagrams:
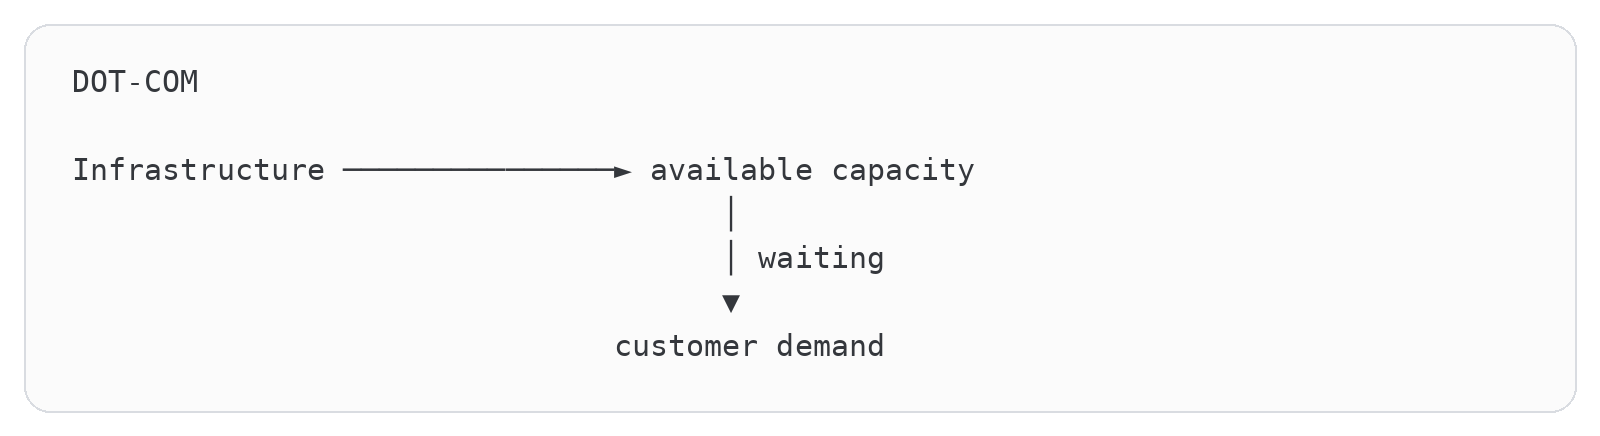
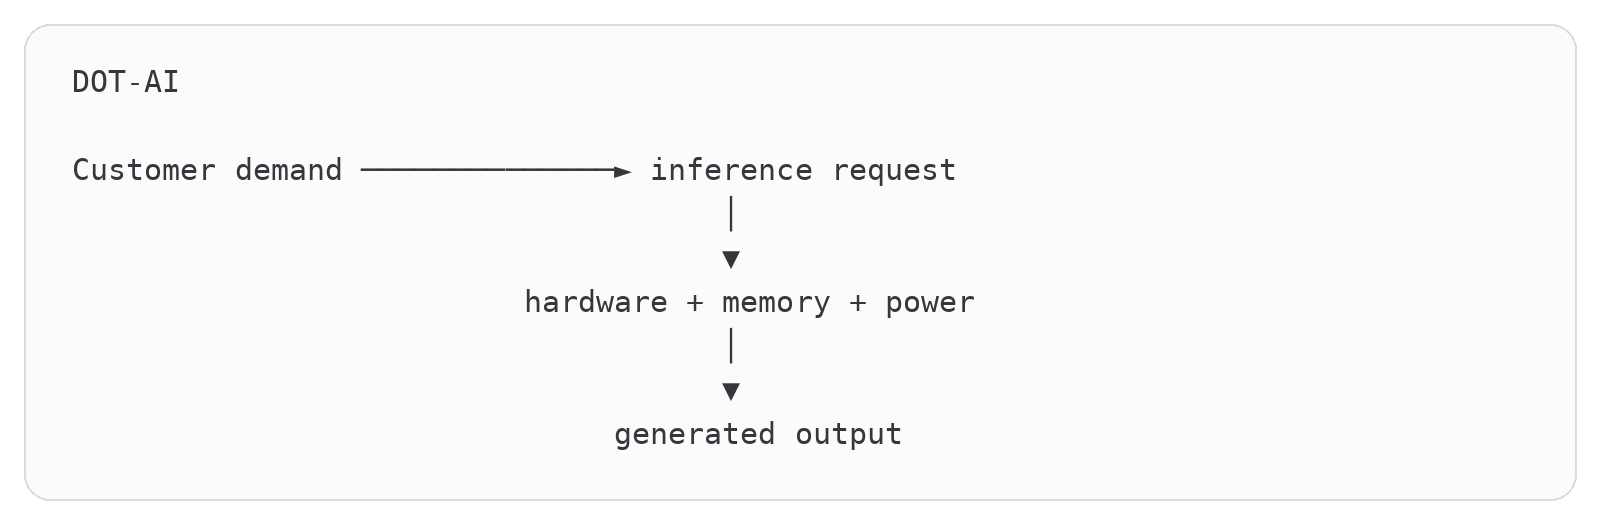
The first bubble asked whether customers would arrive before companies ran out of money. The second asks whether serving customers will become profitable before the industry locks itself into an absurd amount of long-lived infrastructure. This sounds like a subtle distinction. It isn’t. It changes the variable that can break the system.
For a simplified dot-com business, value depended on demand catching up with capacity:

For a frontier-model provider, value depends on something more like:

The user number can be spectacular while the expression inside those parentheses remains disappointingly small.
Keep that visual in your head. Whenever somebody announces another billion tokens, another million users or another gigantic cloud commitment, mentally draw the parentheses. How much did the customer pay for the useful work? How much did the model provider spend producing it? And how much long-lived capital had to be committed before either number appeared?
The dot-com bubble wasn’t a bubble in whether the internet mattered
The lazy version of dot-com history is that investors funded a collection of ridiculous websites, everyone discovered the internet was fake, and then Amazon somehow crawled out of the wreckage. That isn’t what happened.
The internet was already producing real productivity improvements. Between 1995 and 2000, US productivity growth averaged 2.8% annually, almost double the rate of the preceding 22 years. Technology-sector earnings also grew rapidly. A San Francisco Federal Reserve analysis found that earnings among a sample of publicly traded technology companies increased at an annual rate of 38% between 1998 and 2000.
The underlying technology was real. The productivity improvement was real. Some of the revenue was extremely real.
Investors took those true observations and extended them through a financial funhouse mirror.
If the internet was changing everything, every company associated with the internet could be assigned an extraordinary future. If traffic was growing, monetization would eventually appear. If monetization hadn’t appeared, the company simply needed to grow faster before some less visionary investor asked an irritating question about cash flow. The result was a positive-feedback loop:
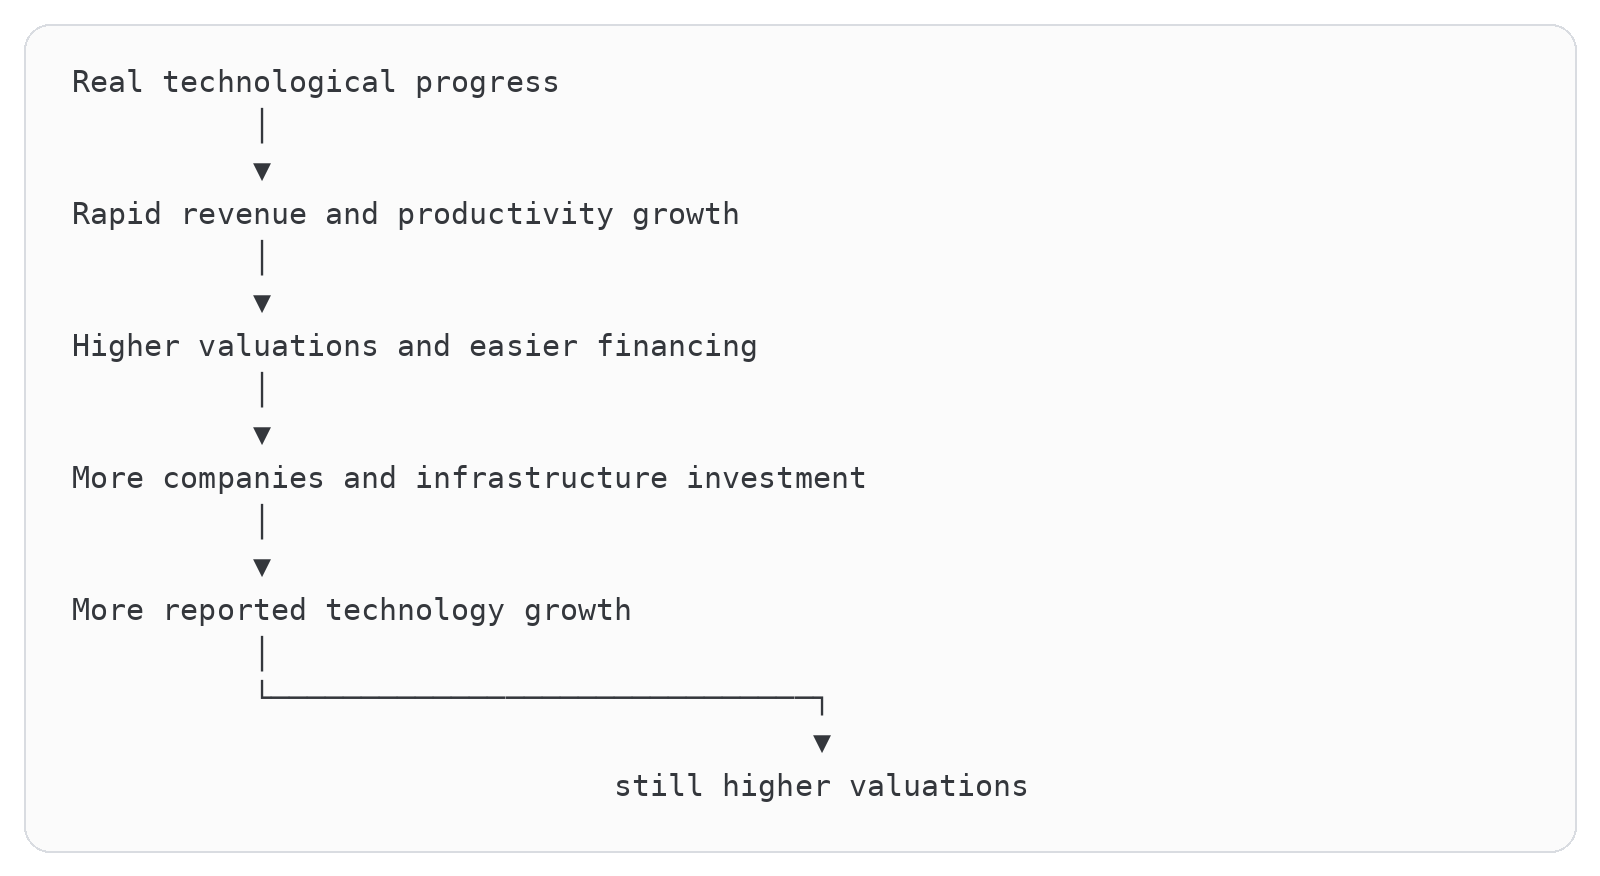
Notice that nothing in this loop requires the technology to be fraudulent. It only requires capital to grow faster than durable returns.
That’s why “AI is real” isn’t a rebuttal to an AI bubble. It’s almost irrelevant. Railroads were real during railway manias. Telecommunications was real during the dot-com boom. Housing was real in 2007. A useful asset can be financed at a stupid price.
The Federal Reserve later described the late-1990s investment boom as plainly overdone. Companies overspent on technology, productive capacity and headcount to satisfy demand that proved unsustainable. The underlying causes included telecom deregulation, the web’s one-time arrival, the Y2K replacement cycle and equipment demand from dot-com companies that subsequently disappeared.
When the assumptions changed, the technology didn’t vanish. The financing did.
Bay Area nonfarm employment subsequently fell by about 350,000 jobs from its December 2000 peak through August 2003, a 9.5% decline. Roughly half the losses were in information technology.
The internet kept winning while a considerable number of internet companies, employees and investors got wrecked. That’s the historical analogy worth preserving.
Put some numbers on the old bubble
The internet of March 2000 was real, useful and commercially tiny relative to the prices attached to it. Census estimated U.S. retail e-commerce at $5.8 billion in the first quarter of 2000, just 0.8 percent of retail sales under the agency’s then-current definition. By the fourth quarter it had reached $9.2 billion and 1.1 percent. That’s observed Census data, not a retrospective estimate. Demand was growing rapidly, but from a base small enough to hide behind the rounding error of total retail.
At the same time, telecommunications firms financed networks around forecasts that treated bandwidth demand like it had discovered nuclear fission. Global Crossing built a fiber network connecting more than 200 cities in 27 countries and entered Chapter 11 in January 2002 with $22.4 billion of assets and $12.4 billion of debt. The network worked. The company couldn’t generate enough cash to service the debt as bandwidth prices fell and expected customers failed to arrive. Equity holders were expected to be wiped out while service continued.
WorldCom filed for bankruptcy in July 2002 with more than $30 billion of debt after an accounting fraud accelerated the collapse. Fraud makes WorldCom an imperfect pure overinvestment example, but the financing lesson is still useful: a functioning network with 20 million customers continued operating while the capital structure failed around it.
The old boom therefore separated three outcomes that investors had bundled together:
The Dot-Com Boom Was Right About Demand and Very Wrong About Timing
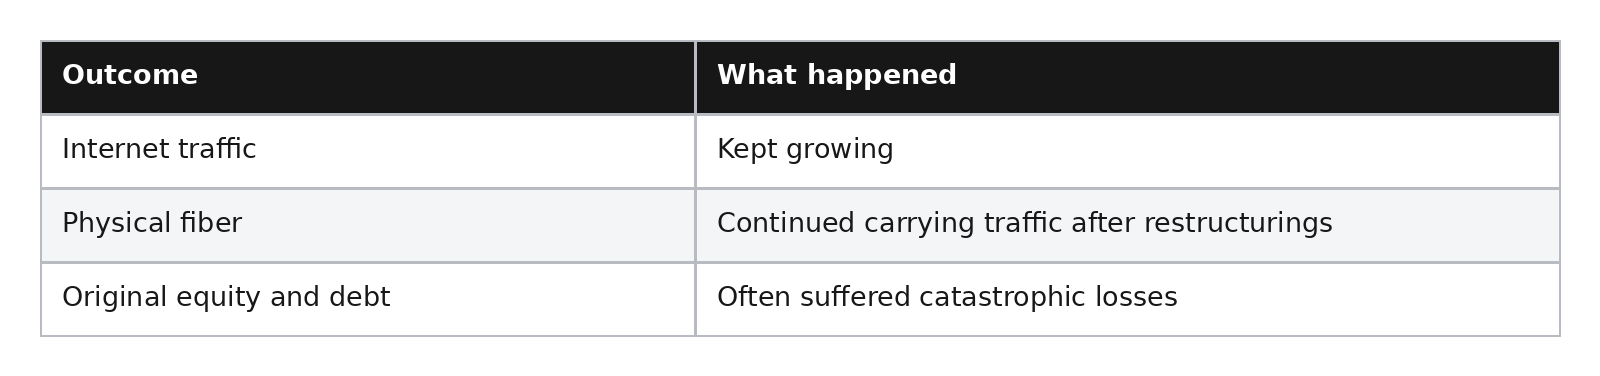
Fiber had one enormous advantage over AI accelerators: glass in the ground didn’t become obsolete every time Nvidia announced a new architecture. Electronics on either end improved, but much of the route remained useful. A B200 cluster can be physically healthy and economically demoted by Rubin, custom silicon or a model requiring far less compute per task. That makes dot-AI’s duration problem potentially harsher:

The comparison shouldn’t be pushed too far. Today’s largest buyers are profitable hyperscalers rather than venture-backed websites with a Super Bowl commercial. AI labs already generate billions of dollars of revenue, and enterprise adoption is much further along than retail e-commerce was in 2000. The analogy isn’t “history repeats.” It’s that a transformational network can survive while the owners who financed the wrong capacity at the wrong price get erased.
A bubble is a bundle of assumptions
People talk about “the AI bubble” as though it’s one wager with a yes-or-no answer. It’s really a bundle of connected assumptions.
Picture the AI economy as a tower of blocks:
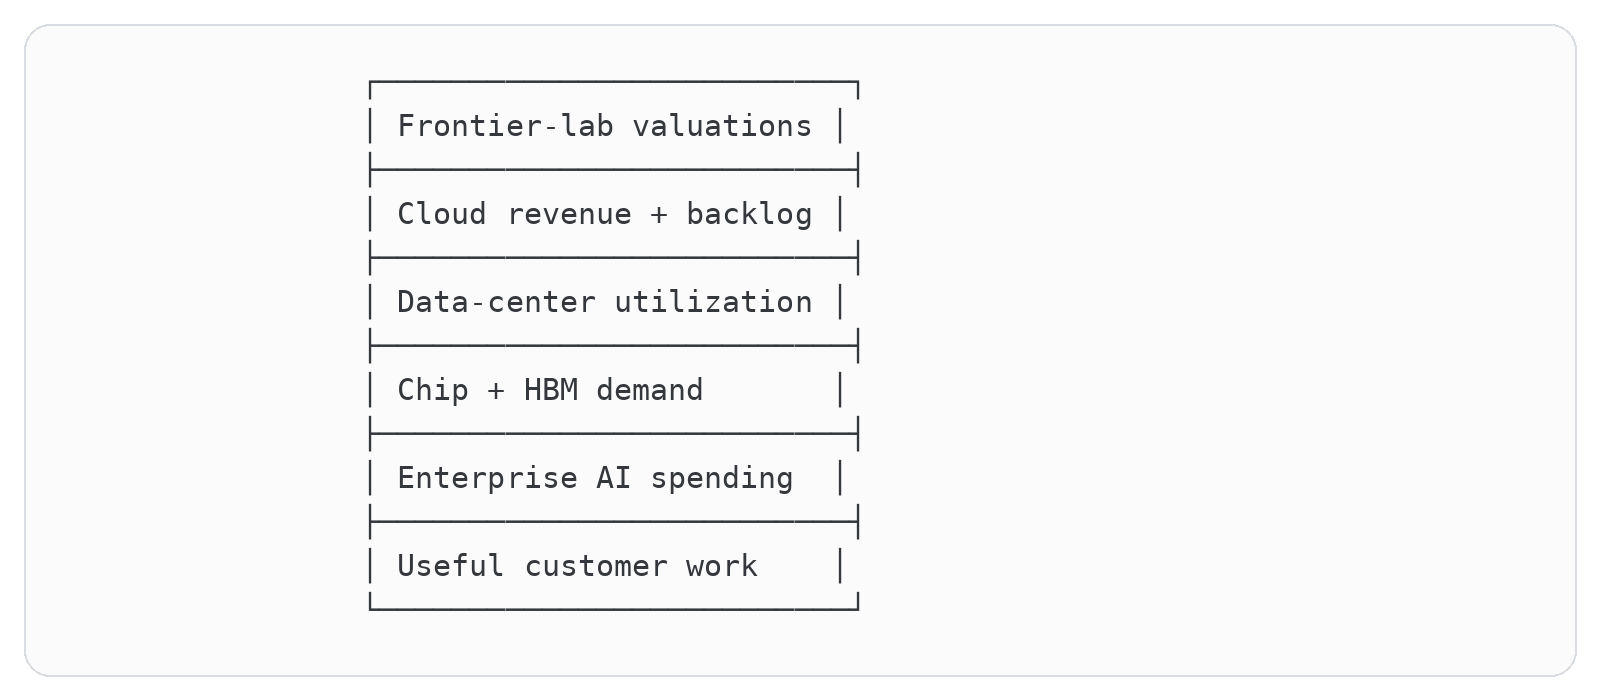
The tower can survive if every layer is merely “pretty good.” But valuations near the top aren’t priced for pretty good. They depend on several layers expanding together for years.
Enterprise spending must keep rising. That spending must produce valuable work. Model providers must retain enough of the value as revenue. The revenue must outrun inference and training costs. Cloud providers must convert laboratory commitments into paid utilization. Hardware must remain useful long enough to recover its construction and financing cost.
The bubble thesis isn’t that every block falls to zero. It’s that the market has priced the top of the tower as though the blocks are largely independent. They aren’t.
If cheap models reduce frontier pricing, lab revenue weakens. If lab revenue weakens, enormous cloud commitments become less dependable. If cloud utilization disappoints, data-center returns fall. If data-center projects get delayed, chip, memory and power forecasts change.
One technical improvement can be socially wonderful while moving financial value downward through the entire stack.
That’s why AI contains such a strange contradiction:
The faster intelligence becomes abundant, the harder it may be for companies valued on its permanent scarcity to earn their expected returns.
A quick note on what these numbers actually mean
Private labs don’t publish the audited segment disclosures we’d demand from a public company, surveys measure intentions rather than cash, and a management forecast isn’t revenue merely because somebody put it in a slide deck. So before we start throwing around enormous numbers, here’s the confidence ladder we’ll use. Higher rows deserve more weight than lower ones, and we’re not going to sneak a lower row into a higher category because the headline sounds better.
Not All AI Numbers Deserve the Same Amount of Trust
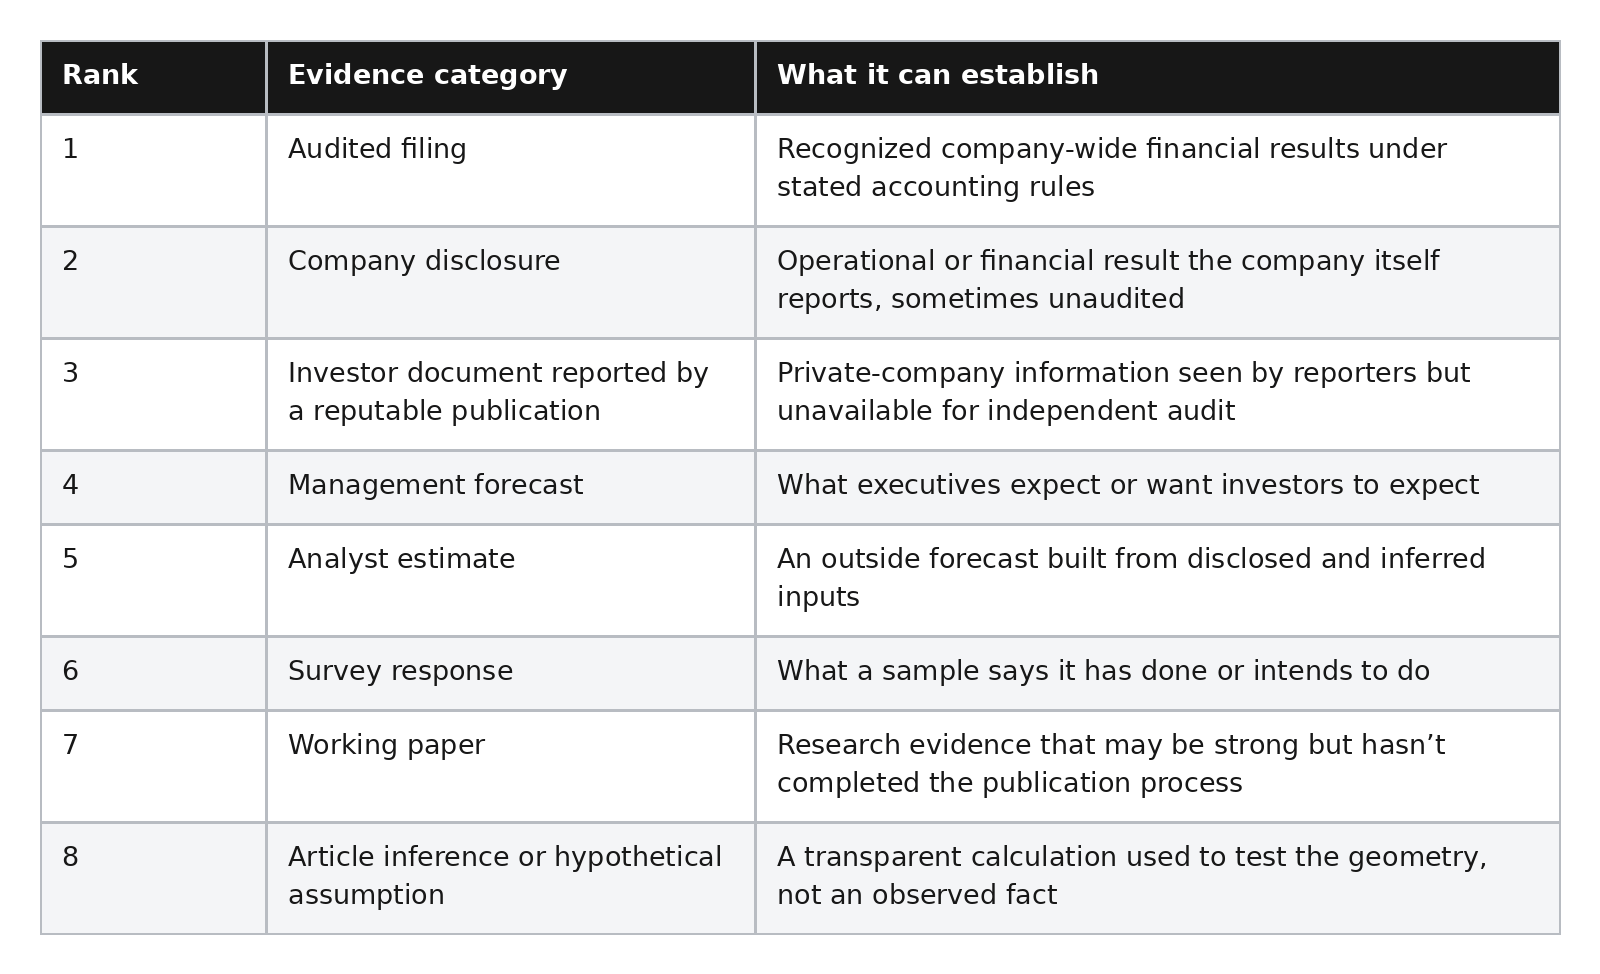
Public-company AI revenue is often undisclosed, so company-wide revenue can’t quietly become “AI revenue.” Private-company run rates can’t become recognized annual revenue. Announced compute commitments can’t become cash already spent. Every major figure below is identified in context by period, definition and evidence type. Where the available evidence can’t answer the question, the correct label is “unknown,” which is less exciting than a made-up number and far more useful.
Here’s how this whole argument could be wrong
Let’s also be fair to the other side. If this thesis can’t be proven wrong, it isn’t analysis. It’s just a personality trait.
The bearish thesis would weaken considerably if frontier labs demonstrate all of the following over several years:
Gross margins improve while agentic usage and context lengths expand.
Capital expenditures and compute commitments grow more slowly than recognized revenue.
Enterprise customers produce measurable revenue growth, not only internal efficiency.
Frontier pricing remains durable despite open and distilled competition.
Current hardware retains economically useful lives close to its financing schedule.
Labor productivity produces market expansion large enough to prevent broad headcount compression.
That world is possible. AI may make so many previously unaffordable services commercially viable that inference efficiency and customer revenue rise together. Personalized education, affordable legal assistance, custom software, drug discovery and autonomous research could create markets far larger than the clerical and software budgets AI initially consumes.
But notice how much has to go right.
The technology doesn’t merely need to improve. It needs to improve along a narrow financial path:

Actually, even that notation is confusing, which is exactly the problem. The labs want capability to rise rapidly, their own costs to fall rapidly, customer prices to fall slowly enough to protect margin, and total customer spending to rise despite those falling unit prices. A cleaner picture is four arrows:

If that combination holds, the industry can grow into the infrastructure.
If customer prices fall faster than production costs, margins get squeezed.
If production costs remain high, adoption becomes expensive.
If both fall rapidly, intelligence flourishes but infrastructure scarcity disappears.
So the whole game is figuring out how wide that path really is.
Chapter 2: One Successfully Completed Task
Atlas is enormous, but its economics are built one accepted task at a time. The enterprise doesn’t ultimately want accelerator-hours, HBM bandwidth or tokens. It wants a repository migrated, a support case resolved, a contract reviewed or an analysis it can actually use. So before pricing the factory, we need to understand what happens inside Atlas between a request entering the system and useful work leaving it.
AI isn’t normal software
The internet was expensive to build, but once the infrastructure existed, information became nearly free to distribute. Serving another webpage, delivering another search result or sending another email eventually became extremely cheap. AI doesn’t work quite like that.
Every time Claude writes code or ChatGPT reasons through a problem, a physical system has to perform the work. Model weights must be stored and moved through memory. The system maintains a KV cache containing information about the active conversation. GPUs, networking equipment, cooling systems and data centers consume electricity while generating every token.
The internet made information nearly free to distribute. AI makes intelligence possible to manufacture, but it hasn’t made intelligence free to manufacture.
A traditional SaaS company can build its product once and serve millions of additional customers at a very low marginal cost. An AI company can train a model once, but it still has to manufacture every response individually.

Frontier AI is therefore closer to an industrial process hiding behind a chat box than ordinary software.
The four rooms inside the intelligence factory
It helps to stop thinking about “a GPU” as one magical black box.
Imagine walking through an intelligence factory with four connected rooms.
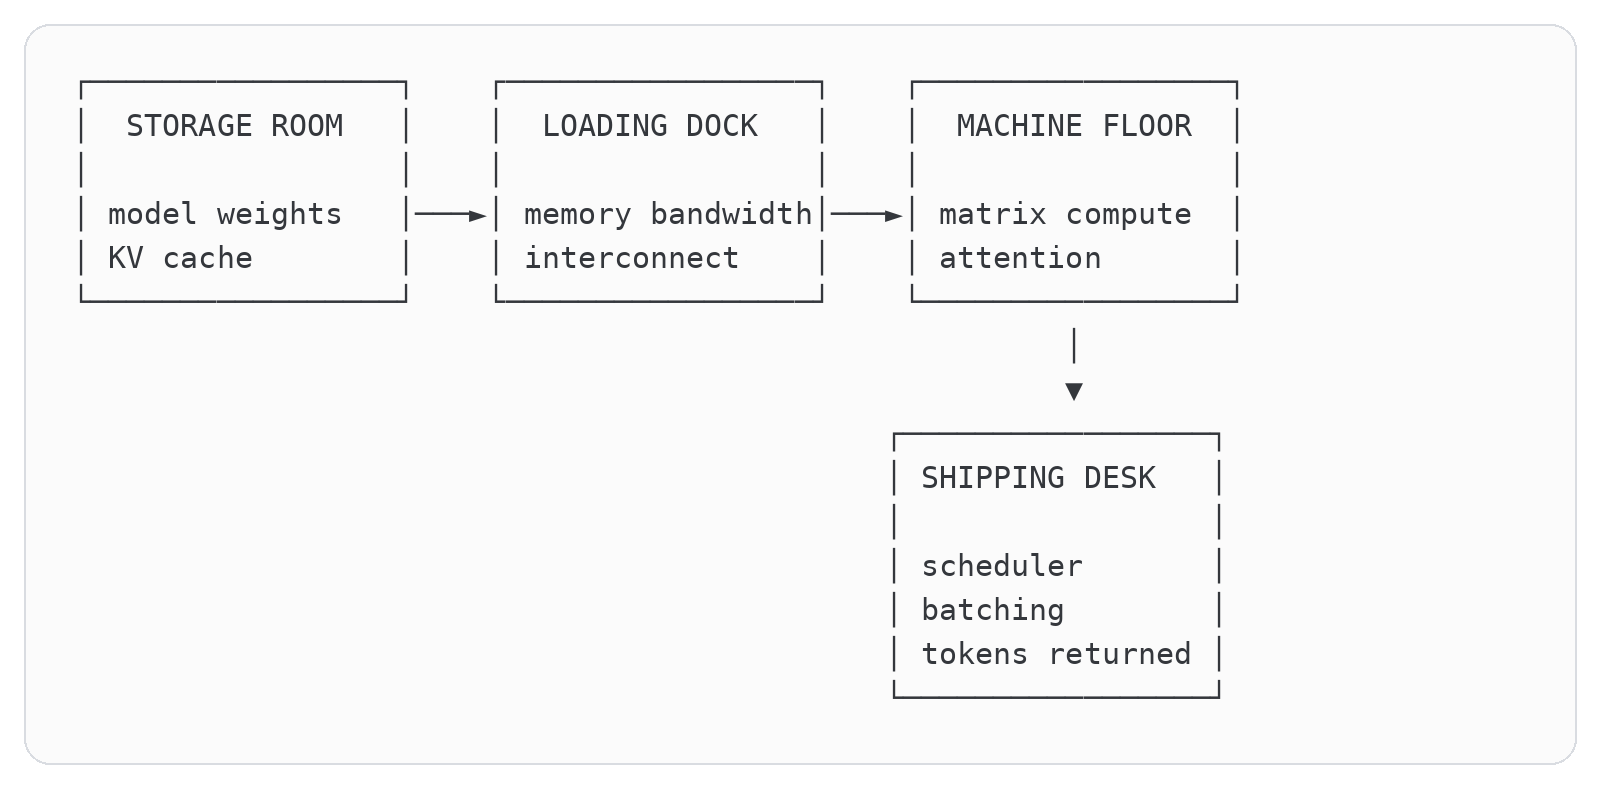
The storage room determines whether the model and active conversations fit.
The loading dock determines how quickly weight and cache data reach the arithmetic units.
The machine floor determines how much mathematical work can be performed each second.
The shipping desk determines whether many customer requests can be combined efficiently without making everybody wait forever.
AI hardware marketing tends to point at the machine floor because the numbers are enormous. A modern accelerator can advertise multiple petaflops of low-precision matrix performance. That sounds like the whole story until the machine floor runs out of material because the loading dock can’t deliver weights quickly enough.
This gives us four constraints that people constantly mix together:
The Bottleneck Moves Depending on the Workload
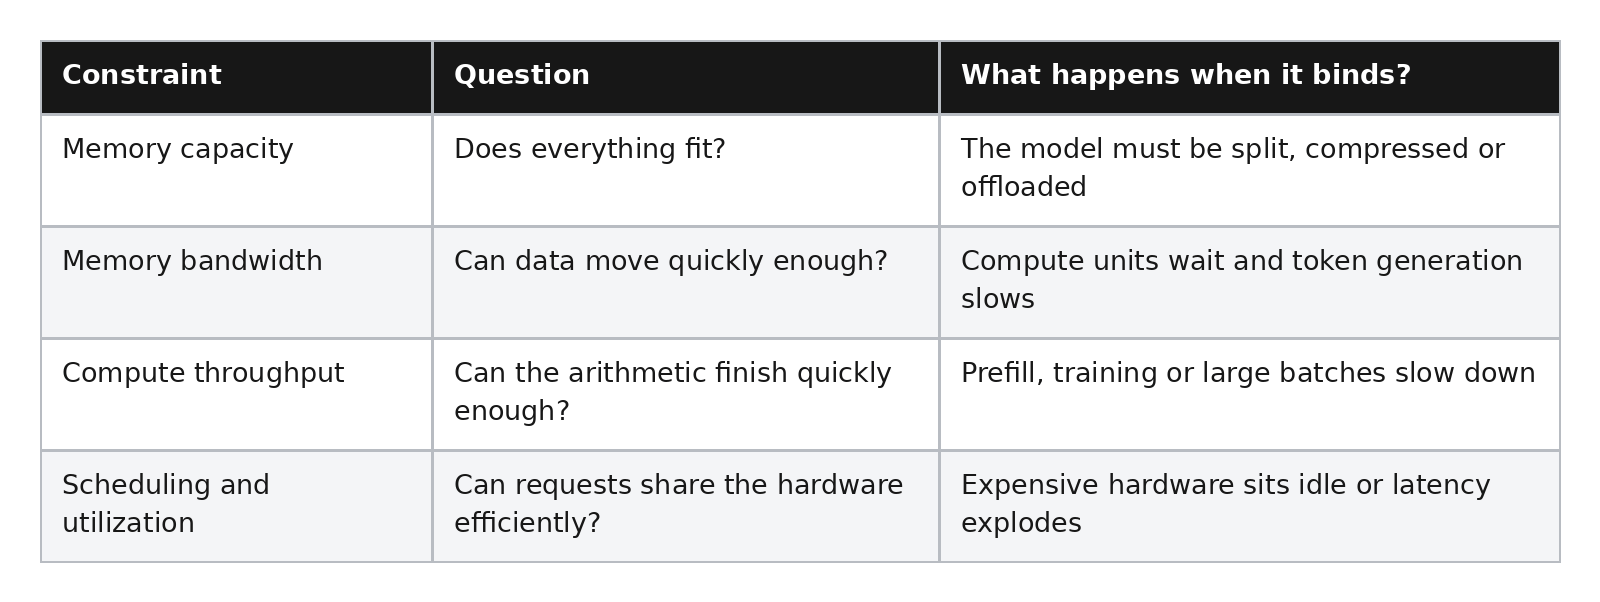
A bigger memory doesn’t necessarily move data faster. Faster memory doesn’t help if the model doesn’t fit. More FLOPs don’t help if the arithmetic units are waiting. Larger batches improve utilization but consume additional KV cache and can hurt latency.
There is no single “make AI cheaper” knob.
There is a panel of knobs connected to one another with string, and turning one can make a different constraint worse.
Capacity is not bandwidth
Suppose a library contains one million books. That tells us its capacity.
Now suppose the librarian can deliver only one book per hour. The library contains plenty of knowledge, but the reader will spend most of the day staring at an empty desk. Capacity answers:

Bandwidth answers:

The distinction is visible in current hardware. AMD’s MI350X contains 288 GB of HBM3E and advertises up to 8 TB/s of peak memory bandwidth. An eight-accelerator platform therefore contains about 2.3 TB of HBM, although each accelerator retains its own local 8 TB/s pathway and the devices still require a high-speed interconnect to cooperate.
Micron’s HBM3E provides more than 1.2 TB/s per memory stack. Its HBM4 generation increases that to more than 2.8 TB/s per stack, using a bus twice as wide and claiming more than a 20% improvement in power efficiency over HBM3E.
Those improvements are extraordinary. They’re also evidence that memory movement remains important enough to justify redesigning and stacking some of the most complicated silicon on Earth.
If raw arithmetic were the only thing that mattered, the industry wouldn’t be spending this much money teaching memory to run faster.
A napkin model for decode speed
Now we can build a deliberately simplified model.
Imagine a dense 100-billion-parameter model stored at four bits per parameter. Its weights occupy roughly 50 GB:

For a low-batch autoregressive decode, generating each new token may require streaming a large portion of those weights through memory. In that regime, memory bandwidth frequently constrains throughput. It isn’t a universal law. Increase the batch, lengthen the context, distribute sparse experts, add speculative decoding or push enough matrix work through the accelerator and the bottleneck can migrate into compute, KV-cache movement, interconnect, scheduling, communication or tail latency. You aren’t managing one permanent bottleneck. You’re managing a bottleneck that moves every time the workload changes.
If the system sustained 2 TB/s of usable bandwidth and had to move approximately 50 GB per decoding step, the crude low-batch upper bound would be:
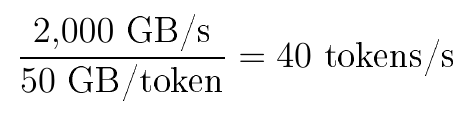
That isn’t a performance guarantee. Real systems have imperfect bandwidth utilization, communication, cache behavior, attention work, synchronization and software overhead. MoE changes the amount of weight data activated per token. Batching allows one weight read to contribute to several sequences.
But the toy equation gives us the right intuition:

Now quantize the same model from four bits to two. Weight storage falls from about 50 GB to 25 GB. If quality survives and every other assumption remains unchanged, the bandwidth-bound ceiling can approximately double.

That’s why quantization can improve both economics and speed. It doesn’t merely squeeze a model onto cheaper hardware. It reduces the amount of material crossing the loading dock.
But “if quality survives” is carrying a refrigerator on its back. Aggressive quantization can damage rare knowledge, reasoning stability, attention behavior or output quality. A compressed model that finishes the wrong task twice as quickly hasn’t halved the cost of useful work.
Why batching looks like free money until it doesn’t
Now place four customers in the factory. Without batching, the system reads the model weights separately for each customer:

With batching, one coordinated weight pass can help advance several sequences:

The weights are being reused across more paid work. Arithmetic intensity rises, memory bandwidth is amortized and total throughput improves.
This is the core economic magic of shared inference infrastructure.
It’s also why accelerator utilization matters as much as the accelerator’s sticker price. An expensive GPU serving a steady, batchable workload can produce cheaper tokens than a cheaper machine sitting mostly idle. We can write the intuition as:

The denominator is where inference businesses live or die. But batching has enemies.
Requests arrive at different times. Prompts have different lengths. Some customers want an immediate answer while others tolerate delay. One sequence may finish while another generates 20,000 tokens. Long contexts occupy more cache. Agentic workloads pause for tools and then return. Safety checks and routing add more stages.
The scheduler can wait to assemble a more efficient batch, but the customer experiences additional latency. It can serve requests immediately, but the hardware does less useful work per weight read.

That’s not a temporary engineering embarrassment. It’s a queueing problem built into a shared service with unpredictable demand.
The first-token and next-token factories are different
When a customer submits a large prompt, the system can process many prompt tokens in parallel. This is prefill. It tends to create large matrix operations that use the GPU’s arithmetic machinery efficiently.
Once the model begins responding, it generates tokens autoregressively. Token 501 depends on token 500. Token 500 depended on token 499. This sequential phase is decode.
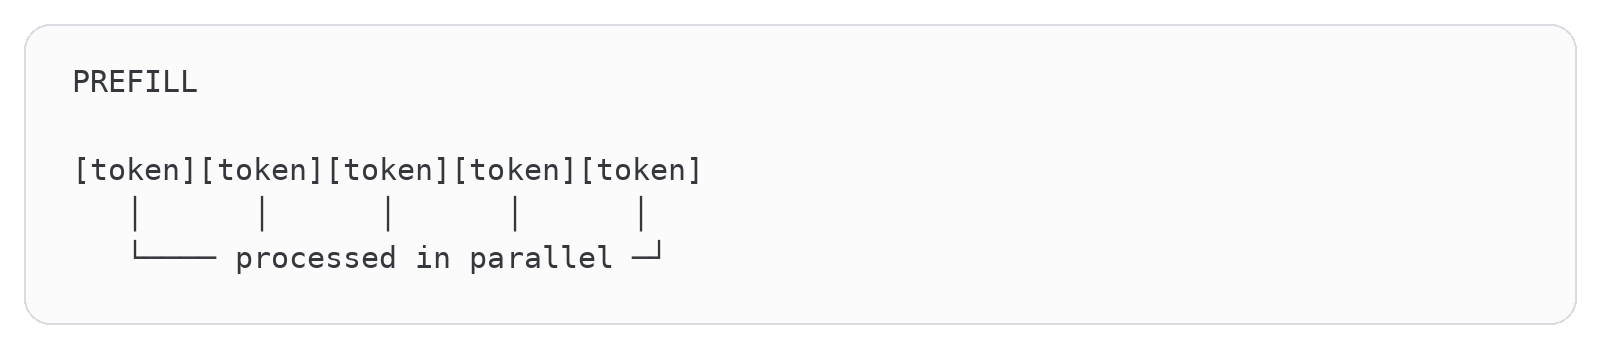

NVIDIA describes prefill as highly parallel and decode as autoregressive. Its own optimization research says LLM decode is typically memory-bandwidth-bound, with long-context decode spending substantial time moving KV-cache data rather than performing arithmetic. This creates two customer-facing latency metrics:
Time to first token: How long the prompt processing and queueing take before the response begins.
Inter-token latency: How quickly subsequent tokens appear once generation starts.
A system can be good at one and bad at the other. A huge prompt may delay the first token while the eventual response streams smoothly. A small prompt can begin immediately but crawl through a bandwidth-limited decode.
That distinction becomes financially important for agents. Human chat tolerates a visible stream of 30 or 50 tokens per second. A background coding agent may care less about pretty streaming and more about total time to complete ten tool calls, three searches and a code-editing loop.
The product metric changes from “does this feel fast?” to “how much useful work does this hardware finish before the billing hour ends?”
Memory is the hidden tax
We usually discuss AI chips in terms of computation. Nvidia announces more FLOPs, models train faster, Jensen signs another leather jacket, and everyone gets excited.
But during token-by-token generation, the GPU is often limited less by arithmetic than by how quickly it can move model weights and cached information through memory. Inference has two broad stages:
Prefill: The model processes the prompt. This tends to be compute-heavy.
Decode: The model generates tokens sequentially. This is frequently constrained by memory bandwidth.
During decode, the model repeatedly reads enormous amounts of weight data to produce one token after another. Its arithmetic units can be ready to work while waiting for memory to deliver the next pile of numbers.
Adding theoretical compute therefore doesn’t automatically generate tokens faster. You can keep installing larger engines, but if the freeway feeding them is jammed, congratulations, you’ve built a very expensive parking lot. Model size creates the first memory problem:

Before including KV cache and runtime overhead, the rough storage requirements are:
How Quantization Shrinks the Model-Weight Memory Bill
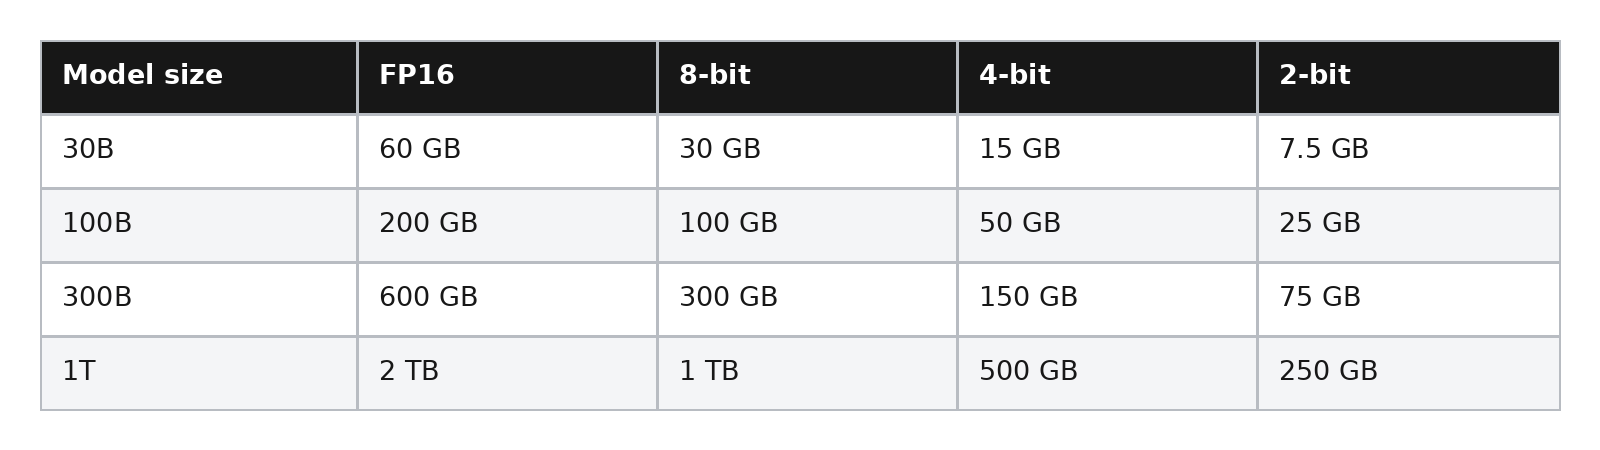
Quantization helps tremendously, but it doesn’t make the physical requirements disappear. Neither does mixture of experts. An MoE model activates only part of its network for each token, reducing arithmetic, but the expert collection still has to be stored somewhere accessible. “Somewhere” doesn’t mean one accelerator’s HBM. Experts can be distributed across accelerators, nodes and memory domains through expert parallelism. The saved arithmetic is partly exchanged for routing, communication, load-balancing and availability problems.
Imagine twenty checkout lanes, only four of which open for any customer. The store doesn’t pay four lanes’ worth of rent. It maintains all twenty, directs each shopper correctly and copes when everybody suddenly chooses the same specialist lane. MoE has the same shape:

Expert parallelism can spread capacity across the cluster, but selected activations then cross an interconnect. A hot expert can create a queue while other experts sit idle. MoE therefore separates total representational capacity from active computation without making storage or the network disappear.
Then there’s KV cache. It prevents the model from recomputing the entire conversation whenever it generates another token, but it grows with context length, concurrent requests and batch size. The relationship is deeply annoying:

The model becomes more useful while the infrastructure becomes less efficient.
KV cache is a per-conversation memory bill
Model weights are mostly a fixed cost for a loaded model. Whether one customer or thirty customers are using the server, the weights have to be resident somewhere.
KV cache behaves differently. Each active sequence brings its own pile of notes.
Return to the library analogy. The model weights are the books on the shelves. The KV cache is the notebook the reader builds while working through a particular problem. A longer conversation creates a thicker notebook. A second customer needs a second notebook. Thirty-two customers need thirty-two notebooks.
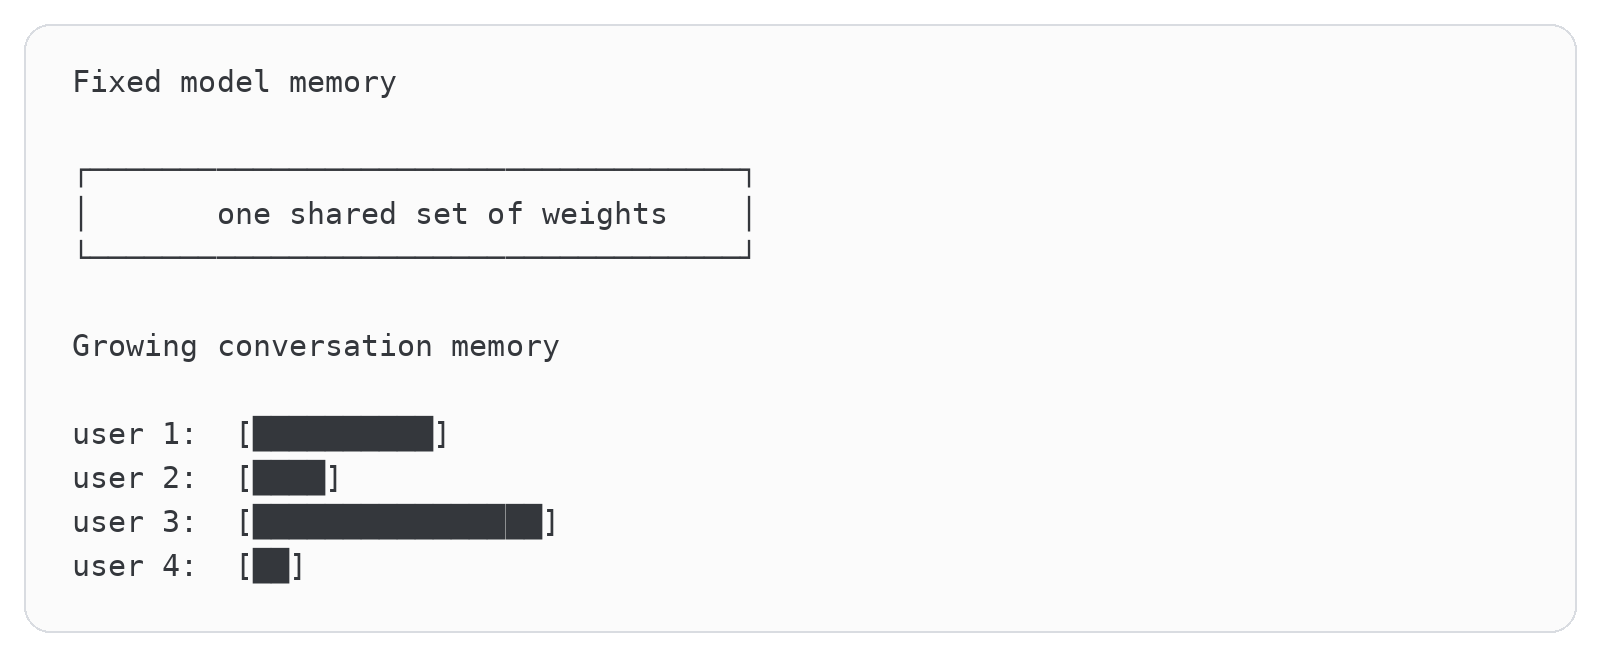
The exact cache size depends on the architecture, precision, number of layers, attention heads and tokens retained. But the directional relationship is simple:

This means context length and concurrency compete for the same memory.
Suppose the weights and runtime consume 70% of available HBM. The remaining 30% is the space available for active conversations. Doubling the average KV footprint doesn’t merely add a modest expense. It can approximately halve the number of conversations that fit at once.
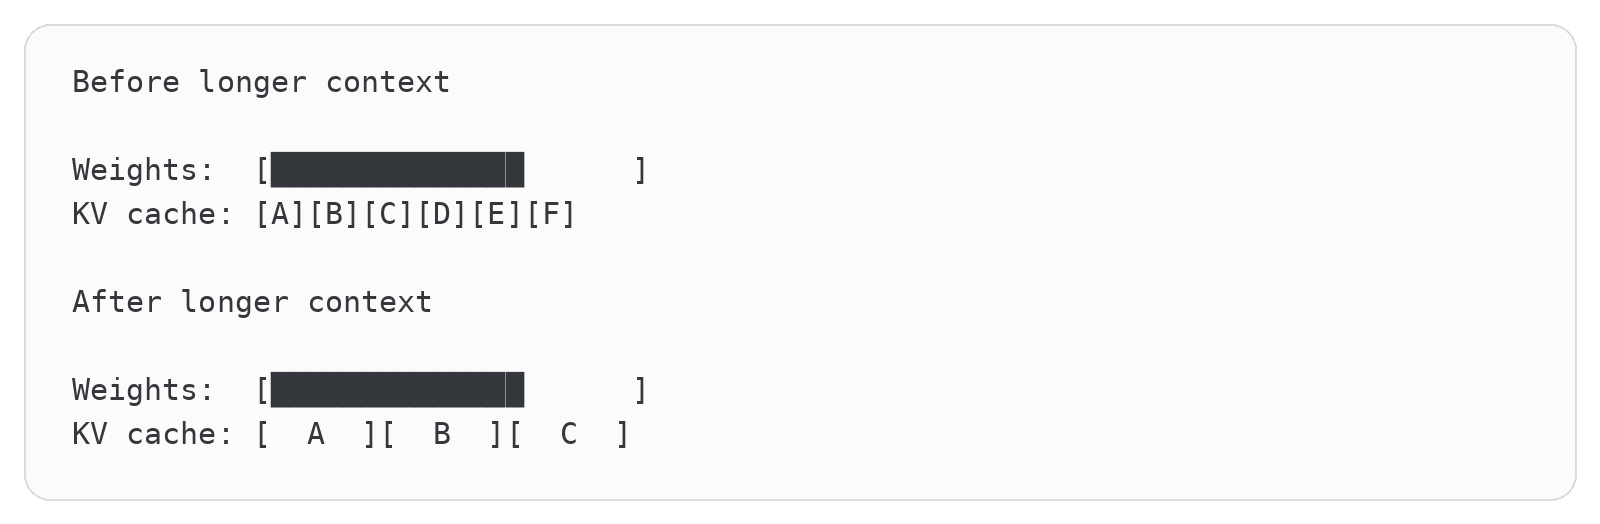
The feature the sales team advertises as “more context” can therefore appear in the infrastructure layer as “fewer simultaneous customers per accelerator.”
NVIDIA’s own work on four-bit KV-cache quantization illustrates the importance of this constraint. Moving from an FP8 cache to NVFP4 can reduce KV-cache memory by roughly 50%, enabling larger contexts, larger batches or more concurrent users. The same optimization also reduces bandwidth pressure during decode.
That’s a major improvement. But notice what the improvement gets spent on. The industry rarely banks all of it as lower cost. It often reinvests efficiency into longer context, more reasoning and more concurrent agent state.
This is AI’s version of Jevons paradox. Make inference cheaper, and products discover new ways to consume it.
Agents turn a conversation into a working set
A chatbot conversation is relatively simple. The user asks a question, the model responds, and eventually the session ends. An agent accumulates state.
It may need the original instruction, repository map, tool definitions, retrieved documents, prior edits, command outputs, failed attempts, test results and a plan for what remains. Some systems summarize or evict older context, but that creates another tradeoff: compression saves memory while risking the loss of something the agent later needs. Picture a contractor working in a room.
At first, the desk contains one blueprint. After an hour it contains building codes, invoices, photographs, revised drawings and notes about three mistakes already fixed. Clearing the desk makes the contractor faster until somebody throws away the one page explaining where the gas line runs.
Agent memory management is the same problem in digital form:


This is why cost per million tokens can become actively misleading. A cheap token used to repeat work forgotten during context compression isn’t actually cheap. A costly token that prevents an agent from corrupting a production database may be a bargain. The useful unit remains the completed task.
Memory improvements can disappear into capability
Now we can see the pattern that keeps showing up everywhere else.
Suppose a new generation of hardware doubles effective memory capacity and bandwidth. A normal software comparison might hold the workload constant and celebrate a large cost reduction. The AI industry often does this instead:
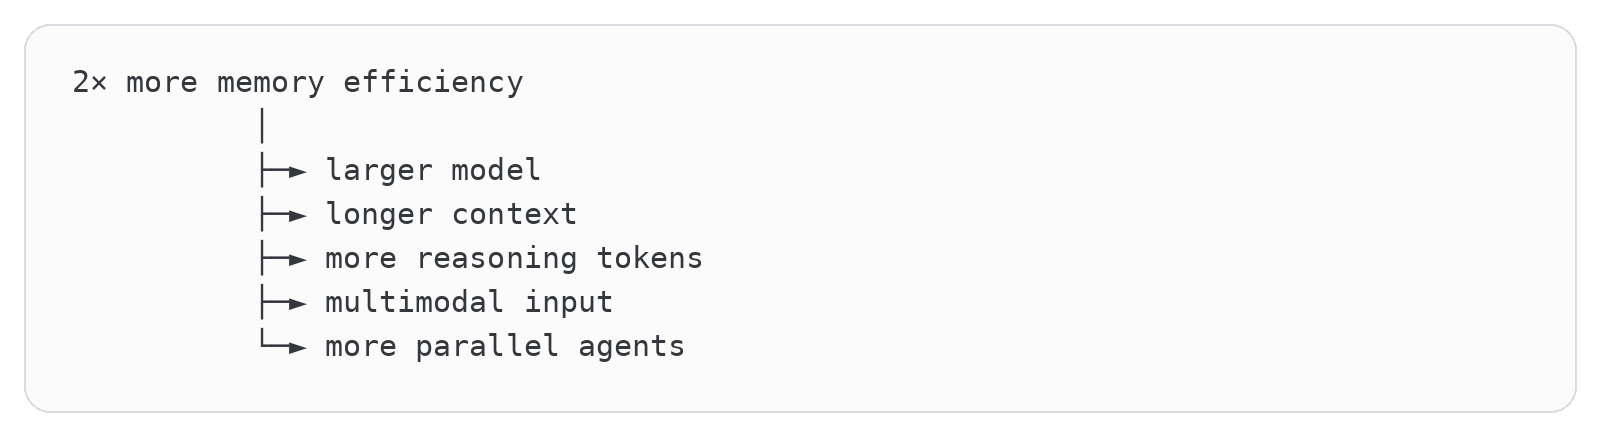
The customer receives a more capable system. But the lab’s cost per completed task may not fall by anything close to the hardware improvement because the definition of a task expands to consume the new headroom.
This doesn’t mean efficiency work is pointless. Without it, the new capabilities might be economically impossible.
It means investors shouldn’t automatically translate a two-times hardware improvement into a two-times gross-margin improvement.
Some portion becomes lower cost. Some becomes higher quality. Some becomes longer context. Some becomes additional usage. And some disappears into the operational complexity of serving irregular agent workloads.
The allocation between those buckets is one of the most important unknowns in frontier-model economics.
Intelligence itself also takes memory
There’s a second memory problem hiding underneath the hardware problem.
An LLM’s parameters are themselves a kind of compressed representational memory. The model’s knowledge of language, programming, history, science, human behavior and millions of obscure patterns is distributed across billions or trillions of numerical weights.
Those parameters don’t store facts like neat rows in a database. But the basic constraint remains:

A smaller model can be outstanding within a narrower distribution. It can also be trained far more intelligently than earlier models of the same size. Parameter count isn’t a clean intelligence dial. Architecture, data quality, training compute, post-training and the allocation of capacity all matter. A well-trained smaller model can humiliate a wasteful larger one.
The stronger claim is that broad, long-tail capability requires representational capacity somewhere in the complete system. Some of it may live in parameters. Some can live in retrieval, persistent memory, tools, search, sparse experts, verifiers, specialized modules or interaction with an external environment. Current frontier systems don’t prove that all of it must permanently reside in dense parameters. They do show that removing capacity without replacing its function tends to lose rare knowledge, subtle behavior or reliability somewhere in the distribution.
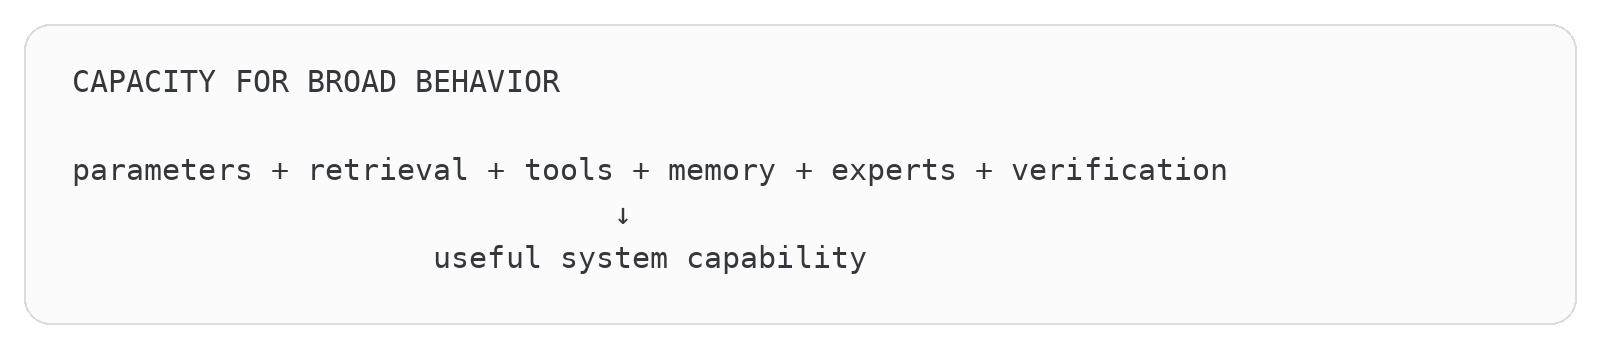
That distinction matters financially. If capability migrates from one enormous resident model into cheap specialists plus retrieval and tools, the demand for premium centralized inference can fall even while the complete system becomes more capable.
That’s why the leading labs continue pushing the frontier even while releasing smaller tiers. Their business, branding and infrastructure plans are still organized around building the smartest broadly capable model, not merely the smallest sufficient model.
Reasoning models make token pricing misleading
The industry loves talking about falling prices per million tokens. But price per token is becoming a less useful measure of economic value.
An older model might receive one prompt and generate 500 tokens. A modern agent might search the web, inspect files, call tools, maintain a huge context, generate internal reasoning, retry failed actions and ask other agents to verify the result.
The token price can fall while the number of tokens and model calls required to complete one useful task explodes.
Suppose token prices fall by 90%, but an agent uses 25 times more tokens and model calls:

The nominal price fell by 90%. The total model cost increased by 150%. The metric that matters isn’t:

The metric we actually care about is:

Now give the denominator teeth:

That’s what enterprises ultimately care about, and it’s what determines whether agents produce gross margin or simply convert payroll into an enormous cloud bill. Nobody buys tokens for spiritual fulfillment. Customers buy accepted work. A lab can lower its advertised token price while retries, supervision and rejected outputs make the completed task more expensive.
This is the first number Atlas has to beat. More accelerator-hours, tokens or benchmark points matter only insofar as they reduce the cost or increase the value of accepted work. With that unit established, we can zoom back out and assemble the physical system required to produce it.
Chapter 3: Build Atlas Outward
Capex is only the money you can see easily
When analysts describe the AI buildout, they usually begin with capital expenditures. That makes sense because capex is visible in cash-flow statements and company guidance.
Epoch AI estimates that combined capital spending by Alphabet, Amazon, Meta, Microsoft and Oracle grew at an average annual rate of 72% from the second quarter of 2023, shortly after GPT-4’s release. It approached half a trillion dollars during 2025. The calculation combines cash purchases of property and equipment with newly obtained finance-lease assets.
Meta’s filings provide a clean example. It spent $69.69 billion on property and equipment during 2025 and initially expected approximately $115 billion to $135 billion of capital expenditures during 2026 to support AI and its core business. Its first-quarter filing subsequently placed the expected range at $125 billion to $145 billion.
But capex is only one way to acquire productive capacity.
A company can buy a data center. It can lease one. It can sign a capacity agreement with a third party. It can commit to buying chips or electricity in the future. It can finance equipment through a special-purpose vehicle. It can ask a developer to borrow the money, build the facility and recover the cost through a long-term lease.
Economically, these arrangements can point to the same building full of accelerators.
Accounting makes them appear at different times and in different places.
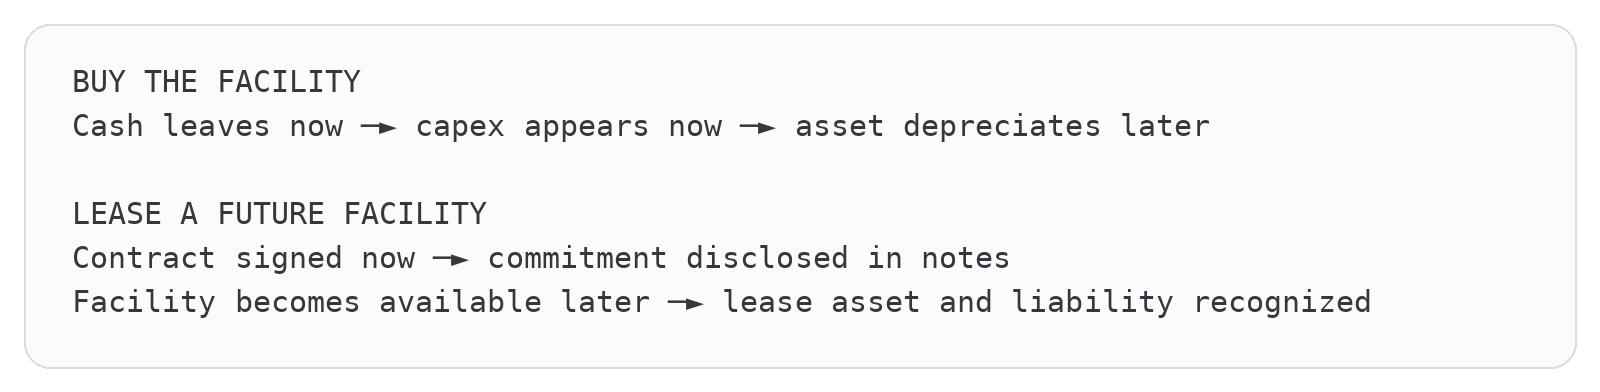
Reuters calculated that Microsoft, Meta, Oracle, Amazon and Alphabet had accumulated about $1.09 trillion in future lease commitments, much of it related to AI data centers. That compared with roughly $285 billion of lease liabilities already recognized on their balance sheets. The gap exists partly because accounting recognition can wait until a facility is operational and available for use.
This doesn’t mean somebody hid a trillion-dollar bill under the couch. The commitments are disclosed, may be conditional and stretch across many years.
It means a cash capex chart can understate how much future infrastructure the industry has already promised to support.
The duration mismatch
Now draw two timelines on top of each other.


The thing generating demand changes every few months. The thing financed to serve it may remain under contract for fifteen or twenty years.
Long-lived infrastructure isn’t automatically reckless. Railroads, power plants and semiconductor fabs also require long commitments. The danger appears when the asset’s economic value depends on one fast-changing customer, architecture or hardware generation.
Oracle demonstrates the concentration problem. Reuters reported approximately $260 billion of pending data-center lease commitments, nearly seven times its recognized lease liabilities, with terms extending roughly 15 to 19 years. Oracle also carried $129.5 billion of debt and faced scrutiny over customer concentration around OpenAI.
We can express the risk as two useful lives:


Financing works comfortably when:

It becomes painful when:

A building can remain physically functional while becoming economically stranded. The power still works. The cooling still works. The racks still blink. But the chips may consume too much power, support the wrong numerical formats, lack sufficient memory or produce tokens at a cost customers no longer accept.
That’s the AI version of owning a perfectly functional DVD factory in 2012.
Backlog is a forecast wearing a nice suit
Cloud backlog sounds reassuring because it represents contracted future business. It’s considerably better than a founder pointing at a total-addressable-market slide and making spaceship noises. But backlog still contains assumptions.
A long-term agreement may include conditions, ramp schedules, cancellation rights, minimums, construction dependencies and customer-credit risk. Revenue arrives only when capacity becomes available and the customer consumes or pays for it under the contract. Think of three increasingly solid layers:
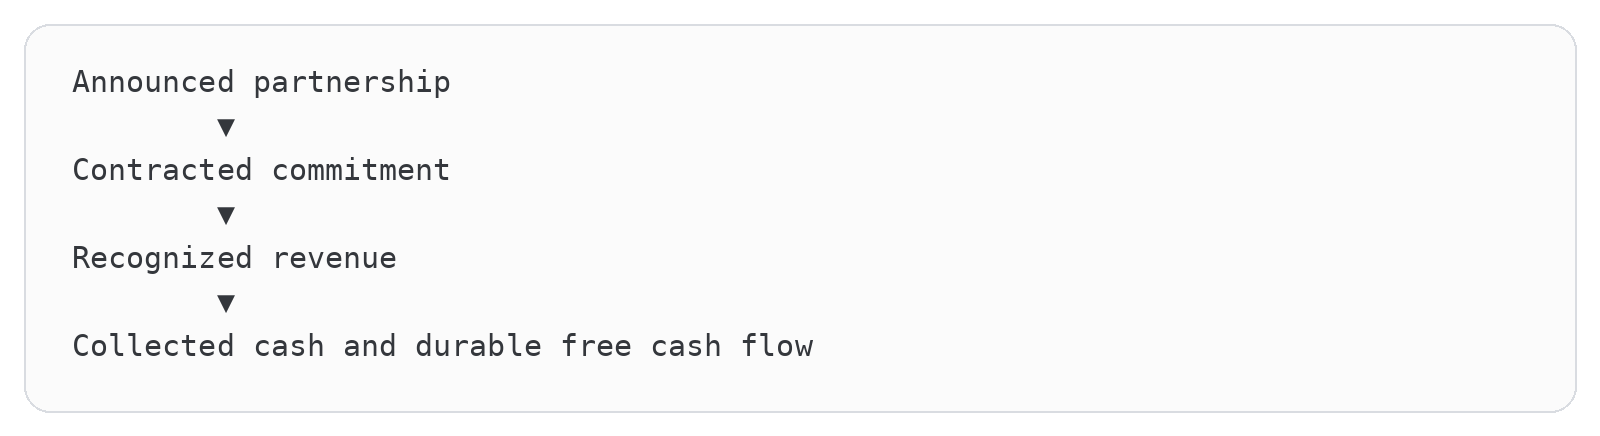
AI coverage frequently jumps from the first or second layer to the fourth.
That’s how a spectacular headline about future compute demand becomes treated as though an enterprise customer has already paid for profitable inference.
The distinction matters because infrastructure construction begins before the final layer is known. Developers borrow against expected rent. Utilities build generation and transmission around expected load. Memory suppliers reserve production. Cloud providers order hardware to meet expected utilization.
The financial system acts on the promise before the economics complete the journey.
The factory extends all the way to the gas turbine
A gigawatt is one billion watts. A one-gigawatt data-center campus running continuously would consume 8.76 terawatt-hours in a year before adjusting for downtime:

That mental model matters because a gigawatt isn’t “a large electric bill.” It’s power-station territory. The campus needs generation or contracts, transmission, substations, transformers, switchgear, backup systems and cooling that can remove essentially the same energy as heat. Nearly every electrical watt entering computing equipment ends up as heat somewhere. The intelligence factory is also a very organized space heater.
Berkeley Lab’s June 2026 bottom-up update estimated that data centers could consume 11.8 percent of U.S. electricity in 2030, with a scenario range of 9.5 to 15.3 percent. Those are modeled scenarios based partly on planned equipment shipments, device energy and cooling performance, not promises about realized construction. The lab’s earlier estimate put 2023 data-center consumption at about 176 TWh, or 4.4 percent of U.S. electricity.
The arithmetic from electricity to useful AI task has several multipliers:

PUE, or power usage effectiveness, is total facility energy divided by IT-equipment energy. A theoretical PUE of 1 means every watt reaches computing. If PUE is 1.2, facilities consume 20 percent on top of IT energy. Now add retries. If an agent requires 1.5 attempts on average and succeeds 80 percent of the time, the energy per successful task is multiplied by (1.5/0.8=1.875) before considering the PUE. A faster chip can be swallowed by longer reasoning, more attempts or worse utilization.
Construction creates a second clock. Chips may improve every year. High-voltage transmission, gas pipelines and turbines don’t appear because a product manager changed the roadmap. Projects wait for studies, permits, interconnection, equipment and skilled trades. EIA’s April 2026 long-run scenarios said data-center load had become a dominant driver of U.S. electricity growth and projected installed generating capacity rising 50 to 90 percent by 2050 across cases, with natural gas, solar and wind accounting for most additions. EIA explicitly describes these as alternative scenarios, not predictions.
During delay, the revenue clock stops but the finance clock doesn’t:

Suppose a $5 billion project is half funded during a one-year delay at a 7 percent cost of capital. Financing carry alone is roughly $175 million before labor escalation, storage, redesign or lost revenue. If accelerators are delivered early, their competitive lives can begin decaying while they’re waiting for power. That is the most Silicon Valley form of tragedy imaginable: obsolete equipment still in the original packaging.
Grid queues also contain speculative or duplicate requests, so announced gigawatts can’t be treated as certain demand. In August 2026, Texas paused approvals for major new data-center grid connections pending an audit. Reuters reported that roughly 90 percent of 474 GW of proposed demand under review was associated with data centers, more than five times the state’s peak load. The number is a queue, not a forecast of facilities that will all be built. Its absurd size is precisely why grid operators require deposits and feasibility tests.
Bottlenecks transfer profit before they destroy it
If gas turbines are scarce, turbine manufacturers gain pricing power. If transformers have multi-year lead times, electrical-equipment suppliers can raise prices and fill backlogs. If HBM is scarce, Micron and SK hynix enjoy better mix and margins. Investors looking only at those suppliers can correctly observe a boom. The lab sees the mirror image:

The scarce component initially validates the AI story because orders and margins soar. Yet every extra dollar paid for memory, power equipment or construction raises the amount of model revenue required to earn the project’s target return. Shortage beneficiaries can flourish while the end customer’s unit economics deteriorate. Gold-rush shovel sellers don’t need every miner to find gold. They need miners to keep financing the search.
HBM is an especially clean example. More bandwidth can raise throughput and lower task cost, but advanced stacks require specialized fabrication and packaging. Micron says its HBM3E delivers more than 1.2 TB per second per stack and its HBM4 more than 2.8 TB per second, with over 20 percent better power efficiency in the company’s comparison. Those are vendor technical claims, not independent workload benchmarks.
Cooling and water complete the loop. Berkeley Lab notes that nearly all data-center electricity becomes heat and estimates U.S. data-center water consumption could reach 0.14 to 0.28 billion cubic meters by 2028 in the cited scenario work. Water use varies dramatically with climate, cooling technology and whether measurement counts onsite use or electricity-generation water.
None of this proves a permanent physical ceiling. Higher-voltage power delivery, direct-to-chip liquid cooling, onsite generation, batteries, geographic load shifting and more efficient models can all help. The bear case is about price and time, not impossibility. The buildout can arrive late and over budget, then enter service into a market whose task prices changed while concrete was curing.
Chapter 4: Atlas’s Complete Economics
How a billion-dollar cluster becomes stranded while every GPU still works
Picture a brand-new cluster after commissioning. The servers pass diagnostics, the fabric is stable, the cooling loops don’t leak and a nervous operations engineer has finally stopped sleeping beside the pager. Nothing is broken. Now suppose the cluster can’t earn enough to repay its financing and replace the hardware before customers migrate to something better. That’s economic stranding: the machine still computes, but the cash flow no longer supports what investors paid for it.
We need a real physical cluster for the example, not fuzzy “accelerator-equivalents.” So let’s build one from public specifications and rental prices. These are hypothetical assumptions, not a forecast for Nvidia, CoreWeave or any specific project.
Start with 1,024 eight-GPU DGX B200-class systems, or 8,192 B200 GPUs. Nvidia specifies 1,440 GB of aggregate HBM3e, 64 TB/s of aggregate memory bandwidth, 10 rack units and approximately 14.3 kW of maximum power per DGX B200. CoreWeave listed an eight-GPU HGX B200 instance at $68.80 an hour in North America in July 2026, equivalent to $8.60 per GPU-hour before discounts. Those are observed vendor specifications and a posted on-demand price, not the cost or realized rate of this hypothetical project.
Build the factory one invoice at a time
Assume each complete eight-GPU server costs the project $450,000 including CPUs, host memory, local storage, support and system integration. That’s a hypothetical procurement assumption. Reuters reported in March 2024 that Nvidia expected individual B200 accelerators to cost roughly $30,000 to $40,000, but a working server costs much more than eight loose GPUs because customers also buy CPUs, memory, NVSwitch, power supplies, storage, chassis and vendor margin.
What It Costs to Build Atlas
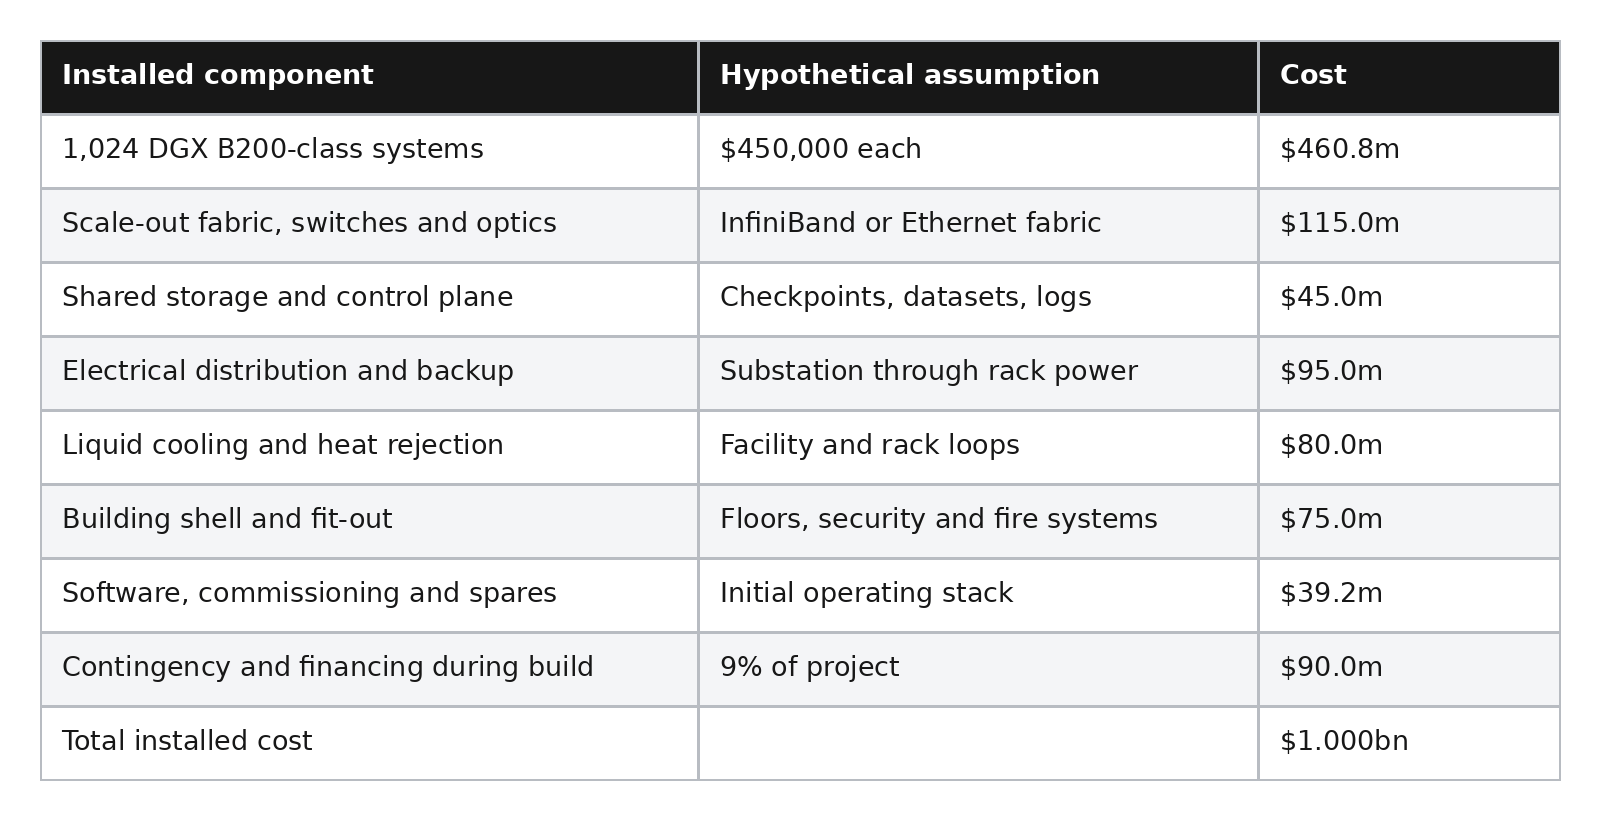
The compute and fabric account for $575.8 million. Storage and software add $84.2 million. The long-lived building, power and cooling plant account for $250 million, and contingency completes the billion. Different projects will allocate these costs differently. The useful point is that we can now see which assets become obsolete quickly and which can be reused.

Finance 60 percent of the project with seven-year amortizing debt at 7 percent and 40 percent with equity. Annual debt service is approximately $111.3 million. That payment is calculated from the standard annuity formula, not guessed:

Turn hardware into sellable hours
The cluster contains 8,192 GPUs and each calendar year contains 8,760 hours:

“Available” doesn’t mean billable. Atlas enters its steady-state year with contracts and expected on-demand traffic covering 78 percent of gross capacity. Planned and unplanned downtime remove 3 percent of gross hours, customer credits and failed billable attempts remove another 1 percent, and ramp plus workload fragmentation remove 4 percent. The bridge is:
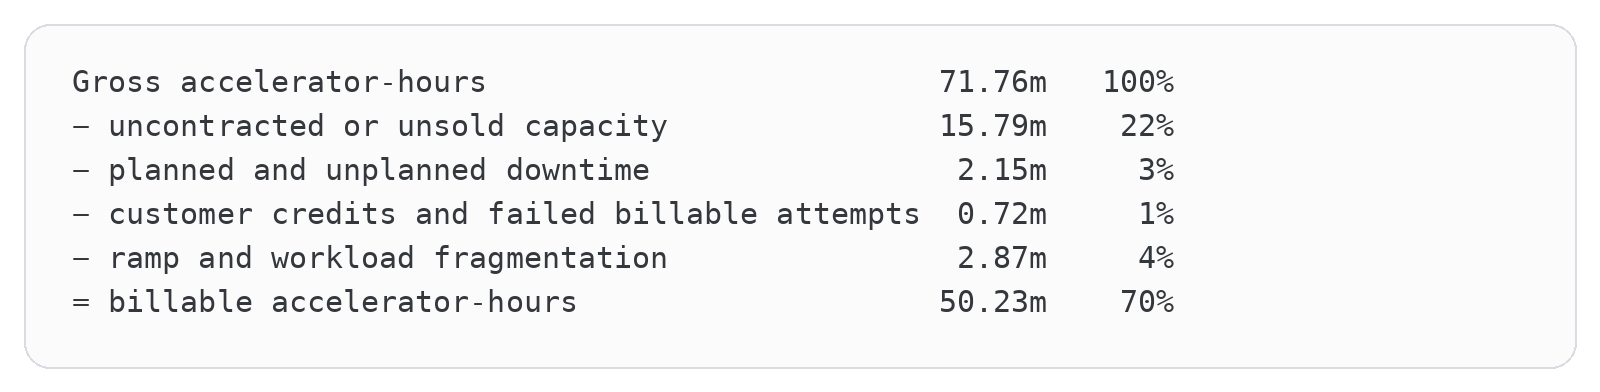
These percentages are hypothetical steady-state underwriting assumptions, not observed CoreWeave or hyperscaler utilization. A real contract would also specify reservation deposits, start dates, service credits, minimum consumption, termination rights and whether unused take-or-pay capacity can be resold. At 70 percent billable utilization:

Assume the project realizes $6.50 per GPU-hour after mixing reserved contracts, on-demand bursts and discounts. That’s below CoreWeave’s posted July 2026 B200 on-demand rate of $8.60 and remains a hypothetical realized price. Annual revenue becomes:

Now power it. The 1,024 systems draw a documented maximum of roughly 14.64 MW before the scale-out network and storage. Assume average IT load of 14 MW across the whole compute and network plant, then multiply by a base-case PUE of 1.20. Facility load averages 16.8 MW:

That’s 147.2 GWh per year. At a blended energy rate of seven cents per kWh, raw energy costs $10.3 million. Add $4.7 million for demand charges, backup testing, water and other utility costs, producing a $15 million annual power-and-water bill. The relatively modest number is a useful correction to loose commentary: for a high-priced B200 rental business, hardware depreciation and utilization can matter far more than electricity. Power becomes existential when it delays the project, restricts deployment or combines with collapsing rental prices.
Base-case economics
Atlas in the Base Case
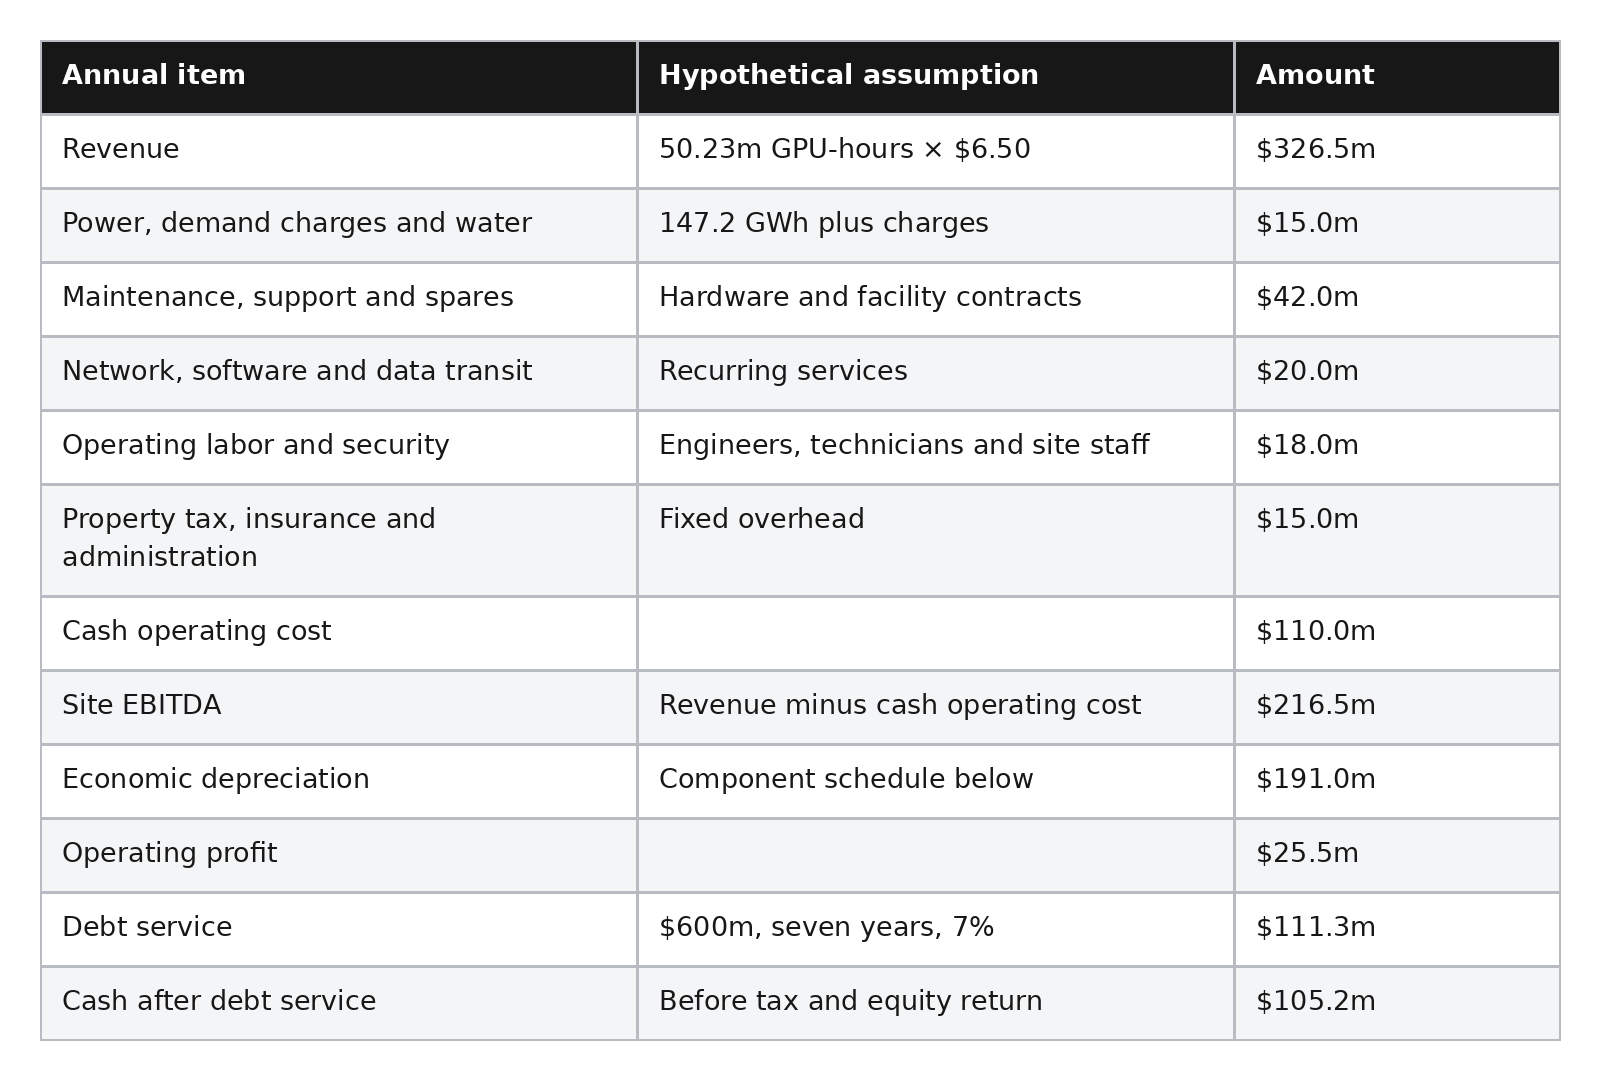
The depreciation schedule assumes four years for the $575.8 million of servers and fabric, five years for $45 million of storage, three years for $39.2 million of software and spares, and ten years for the $250 million building, electrical and cooling plant. That produces about $191.0 million of annual economic depreciation. The remaining $90 million is contingency and construction-financing carry, which is part of invested capital but not itself a separately depreciating productive asset. This is an economic-depreciation estimate, not a claim about any company’s GAAP policy.
The base case covers debt and reports a small operating profit, but “cash after debt service” still isn’t the equity return. Atlas needs maintenance capital, may owe cash tax and eventually has to replace the equipment that produces the revenue. A proper waterfall keeps those checks separate.
From site EBITDA to an equity check
Assume $12 million of annual maintenance capex beyond the service contracts already included in operating cost. In the first year, the $111.3 million debt payment consists of about $42 million of cash interest and $69.3 million of principal. Assume $5 million of cash taxes after available deductions. Atlas then reaches $88.2 million of distributable cash before funding future replacement:
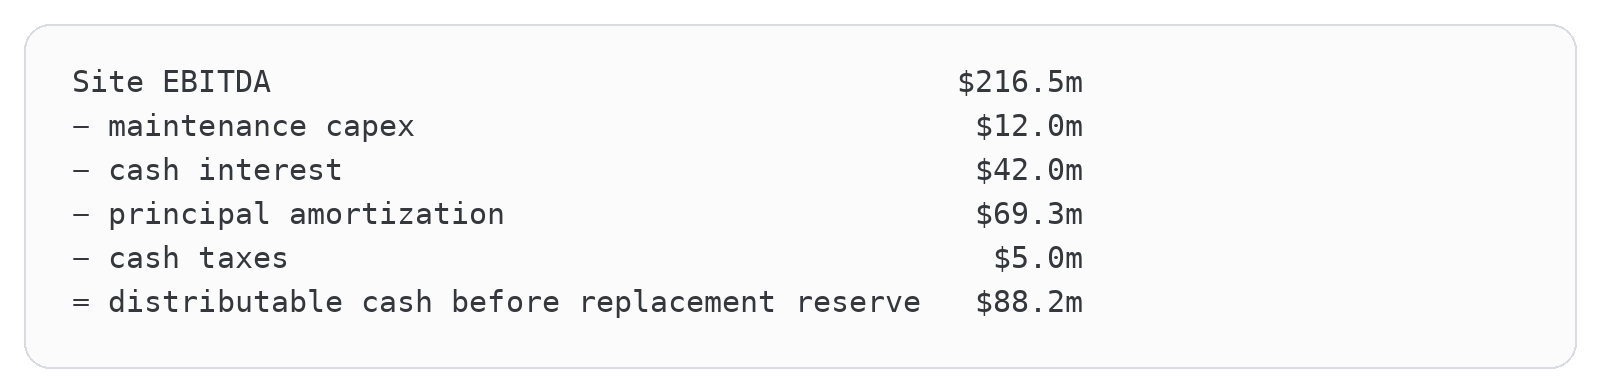
Now comes the part that cheerful project decks tend to leave in the appendix. The servers, fabric, storage, software and spares consume about $166 million of annual economic life. If Atlas expects replacement assets to maintain the same 60/40 debt-to-equity financing, equity must reserve roughly 40 percent of that amount, or $66.4 million a year, while continuing to preserve debt capacity. That leaves approximately $21.8 million of normalized distributable equity cash, a 5.5 percent annual cash yield on the original $400 million equity contribution before considering growth, terminal shell value or changes in replacement cost. It is not a complete equity return. Principal amortization increases the owner’s residual claim, economic depreciation reduces it, and whatever the shell and accelerators are worth at exit can move the final internal rate of return in either direction. Calling 5.5 percent “the return” would quietly treat a wasting hardware asset as though it were a bond that hands the original principal back untouched.

This reserve is an underwriting convention, not GAAP. If lenders refuse to finance replacement equipment, the project needs the full $166 million reserve and distributable cash turns negative. If replacement systems cost less per useful task, the required reserve falls. If the reusable shell, substation and cooling plant retain substantial terminal value, equity gets protection Atlas’s accelerators don’t provide. The central point is that investors supplied $400 million and can’t treat the entire $105.2 million of cash after debt service as profit while the productive core wears out underneath them.
Change one variable: utilization falls to 55 percent
At 55 percent utilization, billable hours fall to 39.47 million and revenue falls to $256.6 million. Assume variable power and support lower cash operating cost from $110 million to $95 million. Site EBITDA becomes $161.6 million, cash after debt service falls to $50.3 million and operating profit after economic depreciation becomes negative $29.4 million.

Utilization is the denominator across which the fixed factory spreads. A 21 percent decline in billable utilization, from 70 to 55 percent, erases more than half the cash remaining after debt service.
Change one variable: realized price falls to $5.50
Return utilization to 70 percent and cut the realized rate from $6.50 to $5.50. Revenue becomes $276.3 million, cash operating profit becomes $166.3 million, cash after debt service becomes $55.0 million and operating profit after depreciation becomes negative $24.7 million. The cluster is busy, liquid-cooled and economically underwater.
This is the central commoditization risk. Price doesn’t need to fall to zero. It only needs to fall below the rate assumed when the asset and debt were sized.
Change one variable: power or PUE worsens
At ten cents per kWh instead of seven cents, raw energy costs rise by about $4.4 million. If PUE also worsens from 1.20 to 1.35 because the site uses less efficient cooling, annual facility energy rises from 147.2 to roughly 165.6 GWh. At ten cents, the combined raw-energy difference from the base case is about $6.3 million. That hurts, but it doesn’t destroy the base case by itself.
This result is important because it keeps the argument honest. Electricity is essential, and delays can be catastrophic, but the depreciation of expensive computing equipment dominates this particular cluster’s annual cost structure. A model claiming otherwise needs to show its wattage, PUE and power price.
Change one variable: the anchor tenant renegotiates
Suppose one tenant represents 40 percent of billable hours and receives a 20 percent discount at renewal. The weighted realized rate falls 8 percent:

Revenue falls by $26.1 million. Cash after debt service falls from $105.2 million to $79.1 million, and operating profit turns slightly negative. The tenant asks for relief precisely when excess capacity weakens the owner’s alternatives.
Change one variable: the hardware life shrinks
If compute and fabric fall from a four-year economic life to three years, annual depreciation on the $575.8 million layer rises from $144.0 million to $191.9 million, a $48.0 million increase. At a two-year life it becomes $287.9 million, a $143.9 million increase from the base schedule.
The old GPUs still run. The problem is that a new accelerator completes the same useful task so cheaply that customers won’t pay the old rental rate. Obsolescence attacks both variables:

Change one variable: construction is delayed by a year
Assume the project has drawn an average $600 million of capital during a twelve-month delay. At a 7 percent financing cost, carry adds roughly $42 million before change orders, storage, labor escalation or lost revenue. If GPU systems arrive before the site has power, part of their competitive life decays inside crates. The cluster then enters service one product cycle closer to replacement.
Change one variable: distillation and routing remove 30 percent of frontier demand
If cheaper models move 30 percent of this cluster’s workload elsewhere, utilization falls from 70 to 49 percent. At $6.50 per hour, revenue falls to about $228.6 million. Assuming $90 million of cash operating cost, cash after debt service falls to $27.3 million and the operating loss after depreciation reaches roughly $52.4 million.
Total AI usage might still be exploding. The displaced tasks could be running on older GPUs, custom silicon or local hardware. The project loses because demand for this generation in this location underperforms, not because society stopped using AI.
Give older hardware a second life
The bear case shouldn’t assume zero residual value. Suppose the compute and fabric retain 15 percent of their installed value after four years because they can serve batch inference, embeddings, scientific workloads or distilled models. Economic depreciation on that layer falls by about $21.6 million per year:

That lifts base-case operating profit from $25.5 million to about $47.1 million. A secondary market materially protects the owner. It doesn’t solve a simultaneous utilization and pricing collapse, but it’s why “old GPU” and “worthless GPU” can’t be used interchangeably.
The one-variable scoreboard
What Happens When One Atlas Assumption Breaks
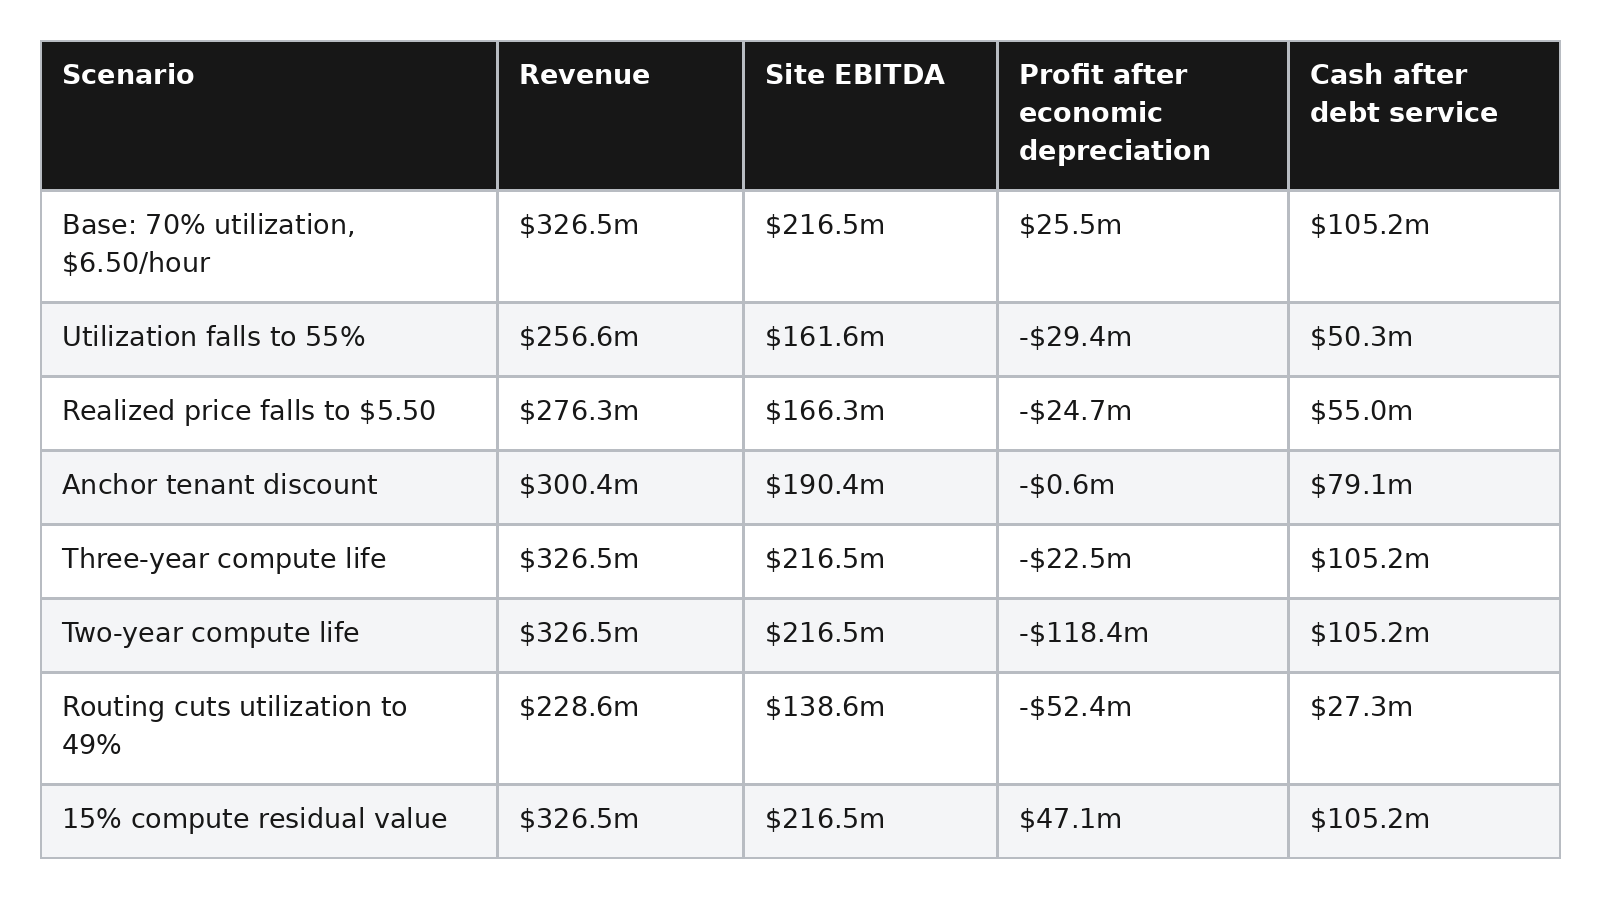
These are our own sensitivities, not analyst estimates. Taxes, reservation deposits, curtailment, financing covenants, failure rates and workload-specific performance would make a real underwriting messier. The geometry is the point. Small misses in price, utilization or useful life consume the narrow layer between cash generated today and capital that must be replaced tomorrow.
Now, Amazon and Microsoft aren’t underwriting one isolated project in a vacuum. They can pool workloads, move jobs between regions, reuse buildings, build custom silicon, negotiate power and fund construction with diversified operating cash flow. That’s a real advantage, and it makes a hyperscaler much safer than a leveraged single-tenant developer. The stranded-asset thesis weakens if we see high utilization across several hardware generations, stable realized pricing per useful task, durable secondary values and returns on invested capital recovering as AI revenue scales.
Chapter 5: What Atlas Actually Has to Earn
We can now stop admiring Atlas as a pile of equipment and ask what the pile has to earn. In the base case, 8,192 B200 accelerators produce 50.23 million billable GPU-hours at 70 percent utilization and a realized price of $6.50 per hour. That creates $326.5 million of annual revenue. After $110 million of cash operating cost, Atlas produces $216.5 million of site EBITDA. After $111.3 million of debt service, $12 million of maintenance capex and $5 million of cash taxes, it has $88.2 million available before replacing the equipment that actually earns the money.
That last phrase matters. If Atlas reserves only the equity-funded portion of its estimated equipment replacement need, normalized distributable cash falls to roughly $21.8 million on the original $400 million equity contribution, or about a 5.5 percent annual cash distribution. The owner may also build equity as debt principal amortizes, lose equity as the equipment economically depreciates and recover value from the shell or secondary hardware market at exit. A proper investment return needs all four. Even so, the annual cash available after a credible replacement reserve is thin enough that a modest utilization miss, price decline or shorter hardware life can make the project unattractive without turning off a single rack.

This is the equation the rest of the article will keep changing. The numerator is not zero. AI creates obvious value. The bearish question is whether enough of that value reaches Atlas after the application, laboratory, cloud provider, customer and financing structure take their pieces. The bullish answer is equally concrete: utilization can rise, task cost can fall, old hardware can find secondary work and induced demand can fill every rack. Great. Now we need to find the customer dollar that makes those things happen.
Part II: Follow the Dollar Down
Chapter 6: One Dollar, Many Claims
“AI stocks” are actually a tower of completely different bets
Now let’s give Atlas a customer. Suppose an enterprise pays $100 for an accepted AI task. The application keeps its workflow margin, the lab charges for inference, the cloud provider recovers capacity cost, the data-center owner collects rent, suppliers recover hardware and electricity cost, and the lender receives interest and principal. This isn’t literal invoice accounting for every workload. It’s a map of how many economic claims are stacked on the same $100 of customer value.

If the customer receives less than $100 of value, somebody must accept a lower margin, subsidize the task or finance the gap. “AI stocks are expensive” is too mushy to identify who. The application company selling an agent, the laboratory training the model, the cloud provider hosting it, the chip designer, the memory manufacturer, the data-center landlord and the electric utility don’t own the same economics. A capability breakthrough that crushes one layer can enrich another. We need to draw the tower.
We also need to distinguish a dollar moving upward through the tower from a new dollar entering it. A cloud provider investing in a lab, a lab signing a compute commitment and an enterprise redirecting payroll into model spending can all create legitimate revenue for somebody in the chain. But they are transfers among existing pools of capital and expense. The tower becomes durably larger only when end customers spend more, new customers enter or lower prices create enough additional volume to expand total revenue. Every layer can report growth for a while before that distinction becomes visible. Eventually, it becomes the only distinction that matters.
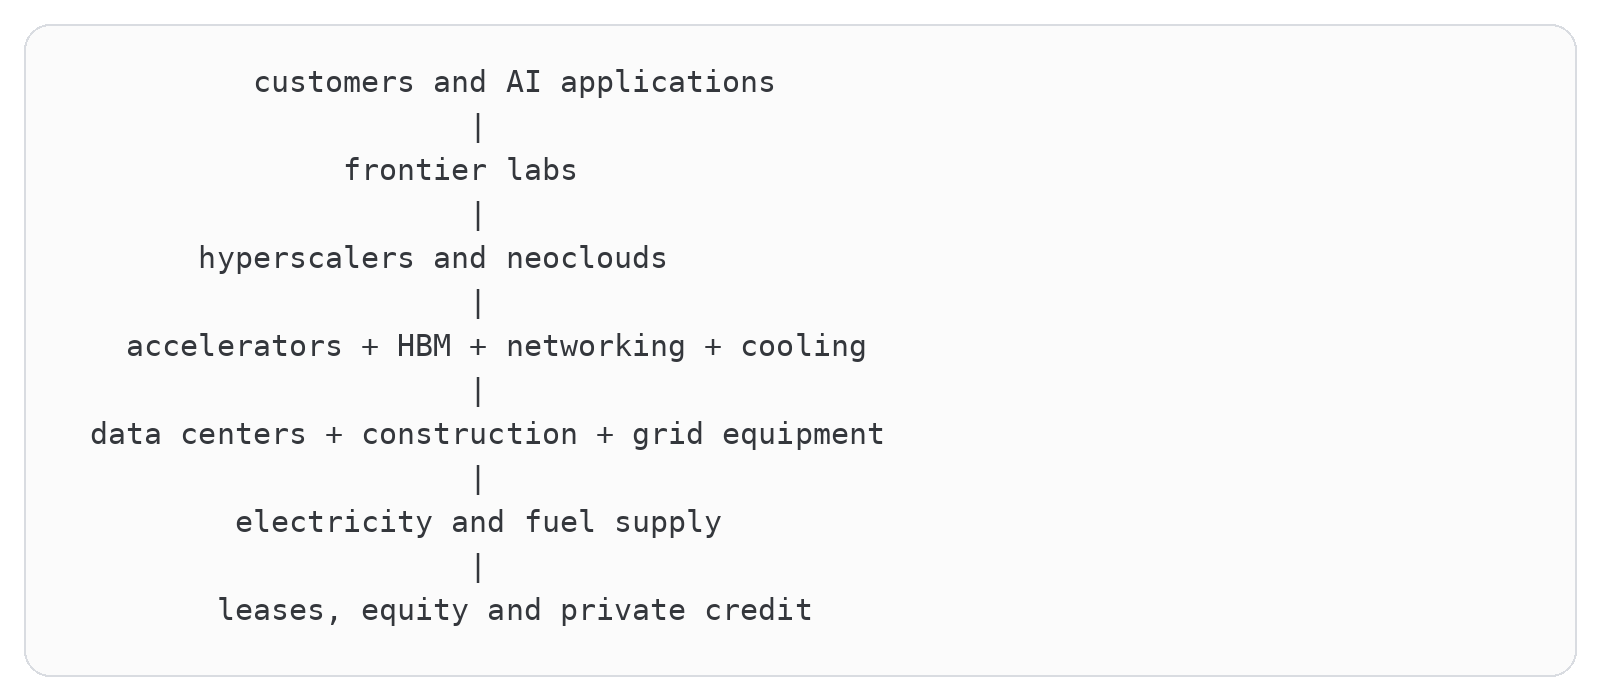
Each layer is making a different promise to its capital providers.
Every Layer of the AI Capital Tower Is Making a Different Bet
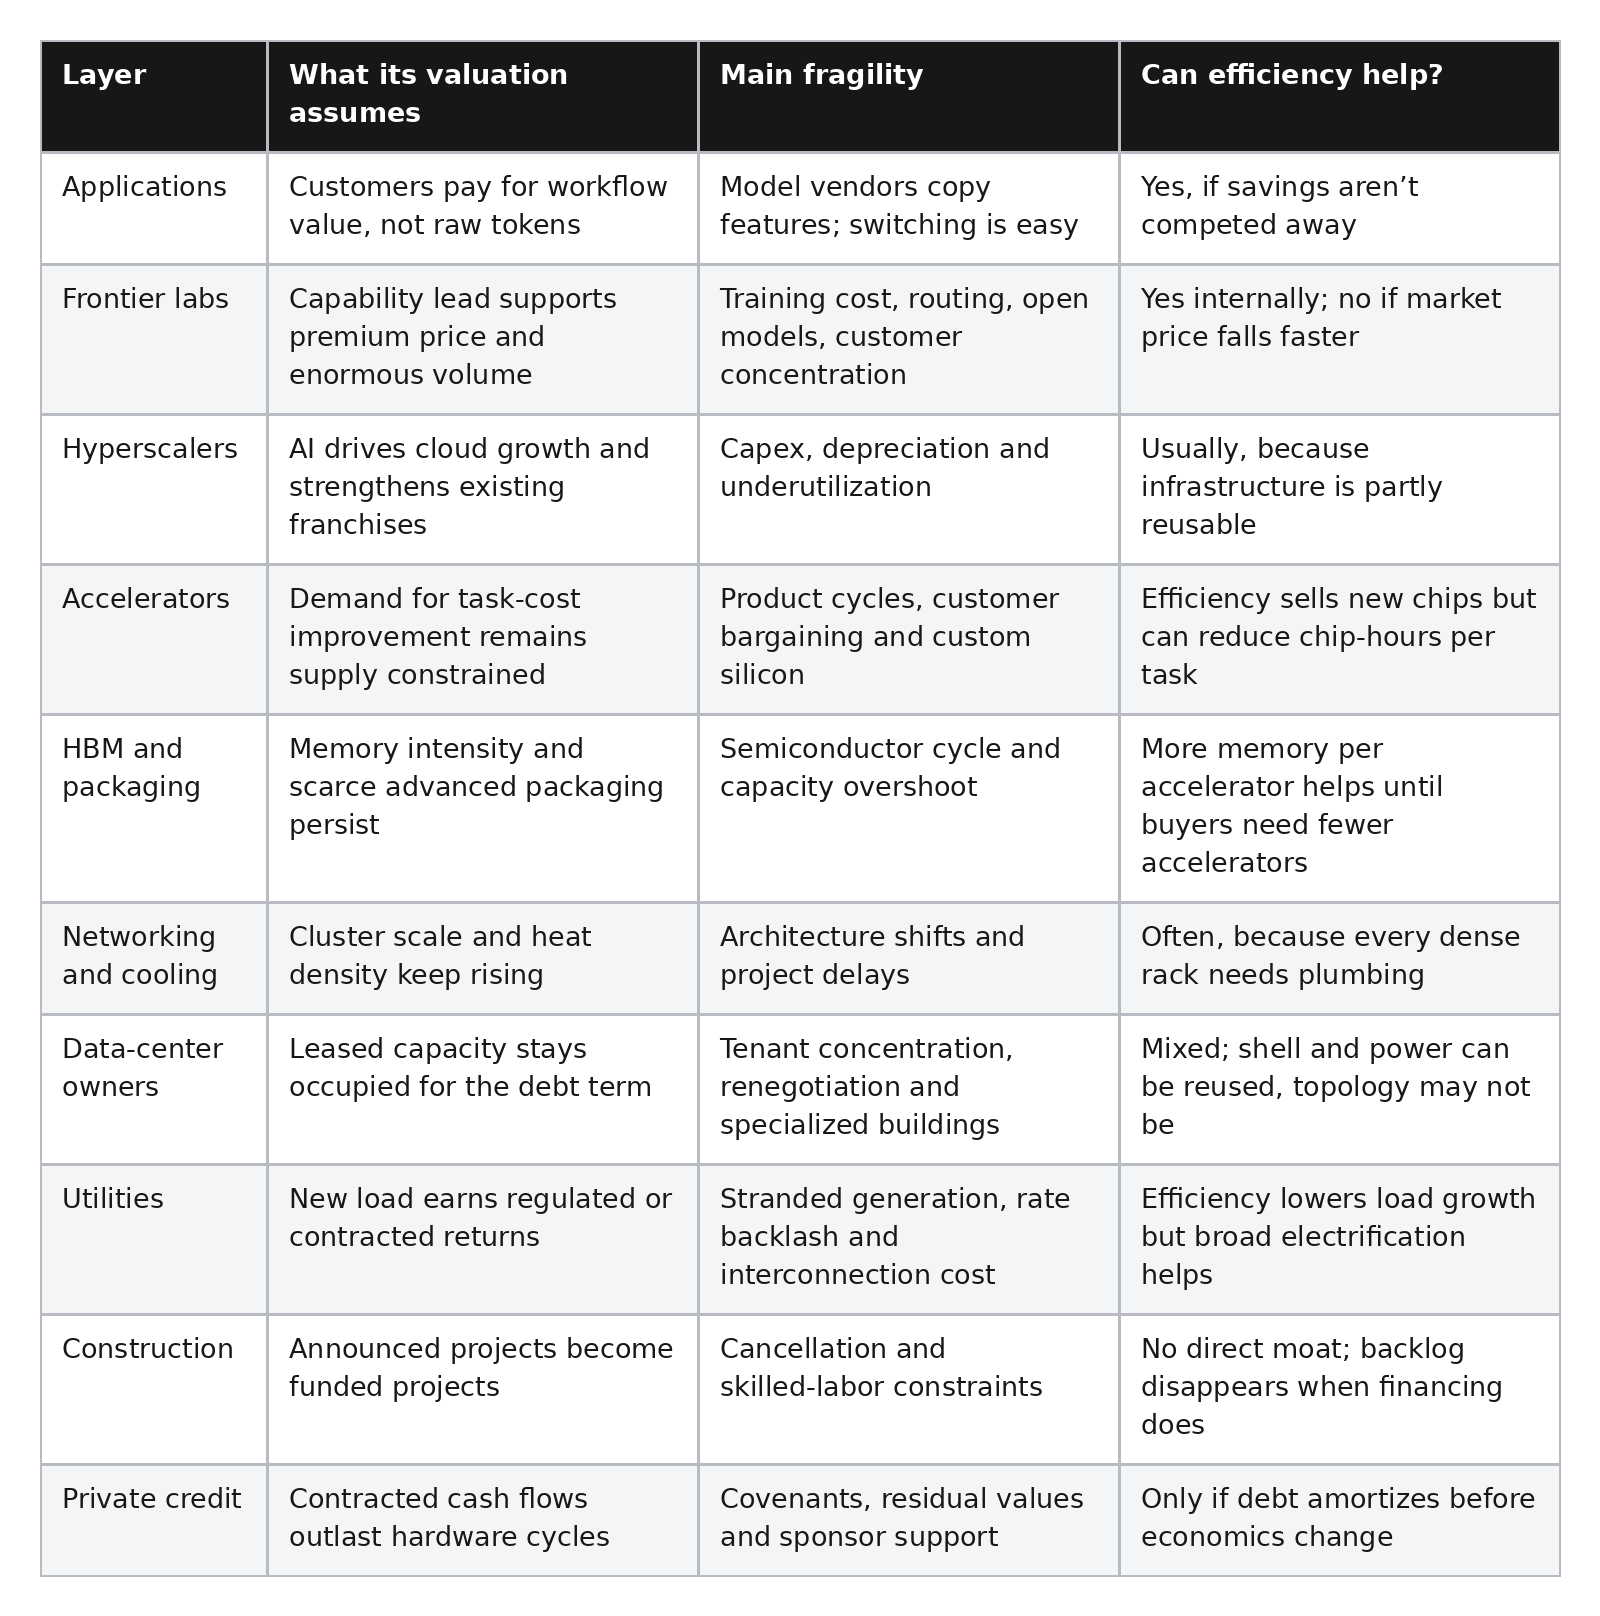
Start at the top. An AI application can have wonderful economics if it owns a workflow, proprietary data, distribution or a regulated relationship. If a legal assistant saves a firm $100,000, its model bill might be $5,000 and its subscription $30,000. Falling inference cost widens the application’s margin. But if twenty competitors buy the same model and offer the same feature, competition passes the savings to customers. “Powered by AI” isn’t a moat when everyone has the same outlet.
The labs have the inverse exposure. They supply the intelligence and carry frontier research cost. Their pricing power depends on being better enough, for long enough, on tasks important enough that customers won’t route away. The hyperscalers are safer in one sense because they already own diversified cash engines. Microsoft can monetize AI through Azure, Microsoft 365, GitHub, security, advertising and its developer ecosystem. Amazon has AWS and commerce. Alphabet has Cloud, Search and advertising. A lab can lose while its cloud provider still fills capacity with another model or ordinary computing. Yet diversification doesn’t repeal arithmetic. In Microsoft’s quarter ended March 31, 2026, servers, network equipment and software at cost reached $190.9 billion, up from $132.8 billion at June 30, 2025. Nine-month depreciation expense rose to $24.0 billion from $15.7 billion a year earlier, and Microsoft said cloud gross-margin percentage declined to 67 percent partly because of AI infrastructure investment and usage. Those are observed filing figures, not an estimate of AI-only assets.
That filing gives us a simple lesson. Capital spending doesn’t disappear when the ribbon is cut. It walks into the income statement as depreciation:

If a $10 billion asset has a five-year life and no residual value, annual depreciation is $2 billion. Change the useful life to three years and it becomes $3.33 billion. Cash went out earlier, but reported margins feel the asset for years. Extending an accounting life improves current profit. Economic obsolescence doesn’t ask the accountant’s permission.
Alphabet’s June 30, 2025 10-Q showed the same conveyor belt at an earlier stage. Six-month property-and-equipment depreciation rose to $9.5 billion from $7.1 billion, and the company disclosed $23.9 billion of not-yet-commenced leases, primarily data centers, scheduled to begin from 2025 through 2031 with noncancelable terms ranging from one to 25 years. That is observed lease disclosure, not an AI-only commitment, though Alphabet explicitly said its technical-infrastructure investment supported AI products and services.
Chip designers sit in a fascinating position. Nvidia can win when labs compete, because every contestant needs shovels. It can also win when efficiency matters, because a new accelerator that halves cost per task gives buyers a reason to replace the old one. But the same improvement shortens the economic life of installed clusters. What’s a product moat for Nvidia can be an impairment problem for Nvidia’s customer. AMD benefits from buyers wanting a second source and from enormous demand exceeding one vendor’s supply, but software compatibility, ecosystem maturity and performance on actual workloads matter more than brochure FLOPs.
Memory suppliers such as Micron and SK hynix have stronger near-term scarcity economics and harsher long-term cyclicality. HBM isn’t ordinary commodity DRAM. It stacks dies, uses advanced packaging and delivers extreme bandwidth close to the accelerator. When capacity is tight, supplier pricing and margins can rise even as labs’ inference margins worsen. Then capital arrives, yields improve, capacity catches up and buyers discover they ordered through the shortage twice. Semiconductor history contains enough inventory corrections to stock a museum.
The bottom layers have longer asset lives and more local monopolies. A transmission line can serve factories, homes and future data centers. A gas turbine can sell power to the grid. A generic powered shell may host non-AI computing. Those are reusable assets. A building designed around one tenant’s liquid-cooled rack density, proprietary interconnect and fifteen-year power contract is less fungible than the word “data center” suggests. Reusability is a gradient:

This is why there won’t be one universal AI crash trade. A cheap-model breakthrough could hurt premium labs and accelerator utilization while helping applications and enterprises. Persistent giant-model demand could enrich Nvidia, HBM and power suppliers while preventing the labs from earning software margins. The transformation can succeed while value migrates down, up or sideways through the stack.
Chapter 7: The Public-Market Stack
A market scoreboard without pretending AI is a reportable segment
Public-market analysis gets silly when analysts assign every dollar of cloud growth to AI and every dollar of capex to a chatbot. Most companies don’t disclose an audited AI segment. Search, advertising, databases, ordinary cloud workloads and AI often share the same infrastructure. The honest scoreboard therefore uses company-wide and disclosed segment figures, then labels management’s AI attribution instead of inventing our own.
The operating snapshot below uses the latest results publicly available through August 7, 2026. Quarterly flows, trailing-twelve-month flows and fiscal-year figures are identified rather than blended. The valuation snapshot uses July 23, 2026 closing market capitalizations so eight moving securities aren’t silently measured on eight convenient dates. Market capitalization is a market observation calculated from price and shares, not an audited financial-statement item. Enterprise value is omitted where a same-date reconciliation of debt, cash, investments and minority claims isn’t supportable from the cited records. That limitation is better than decorating a table with false precision.
What Public-Market AI Valuations Already Assume
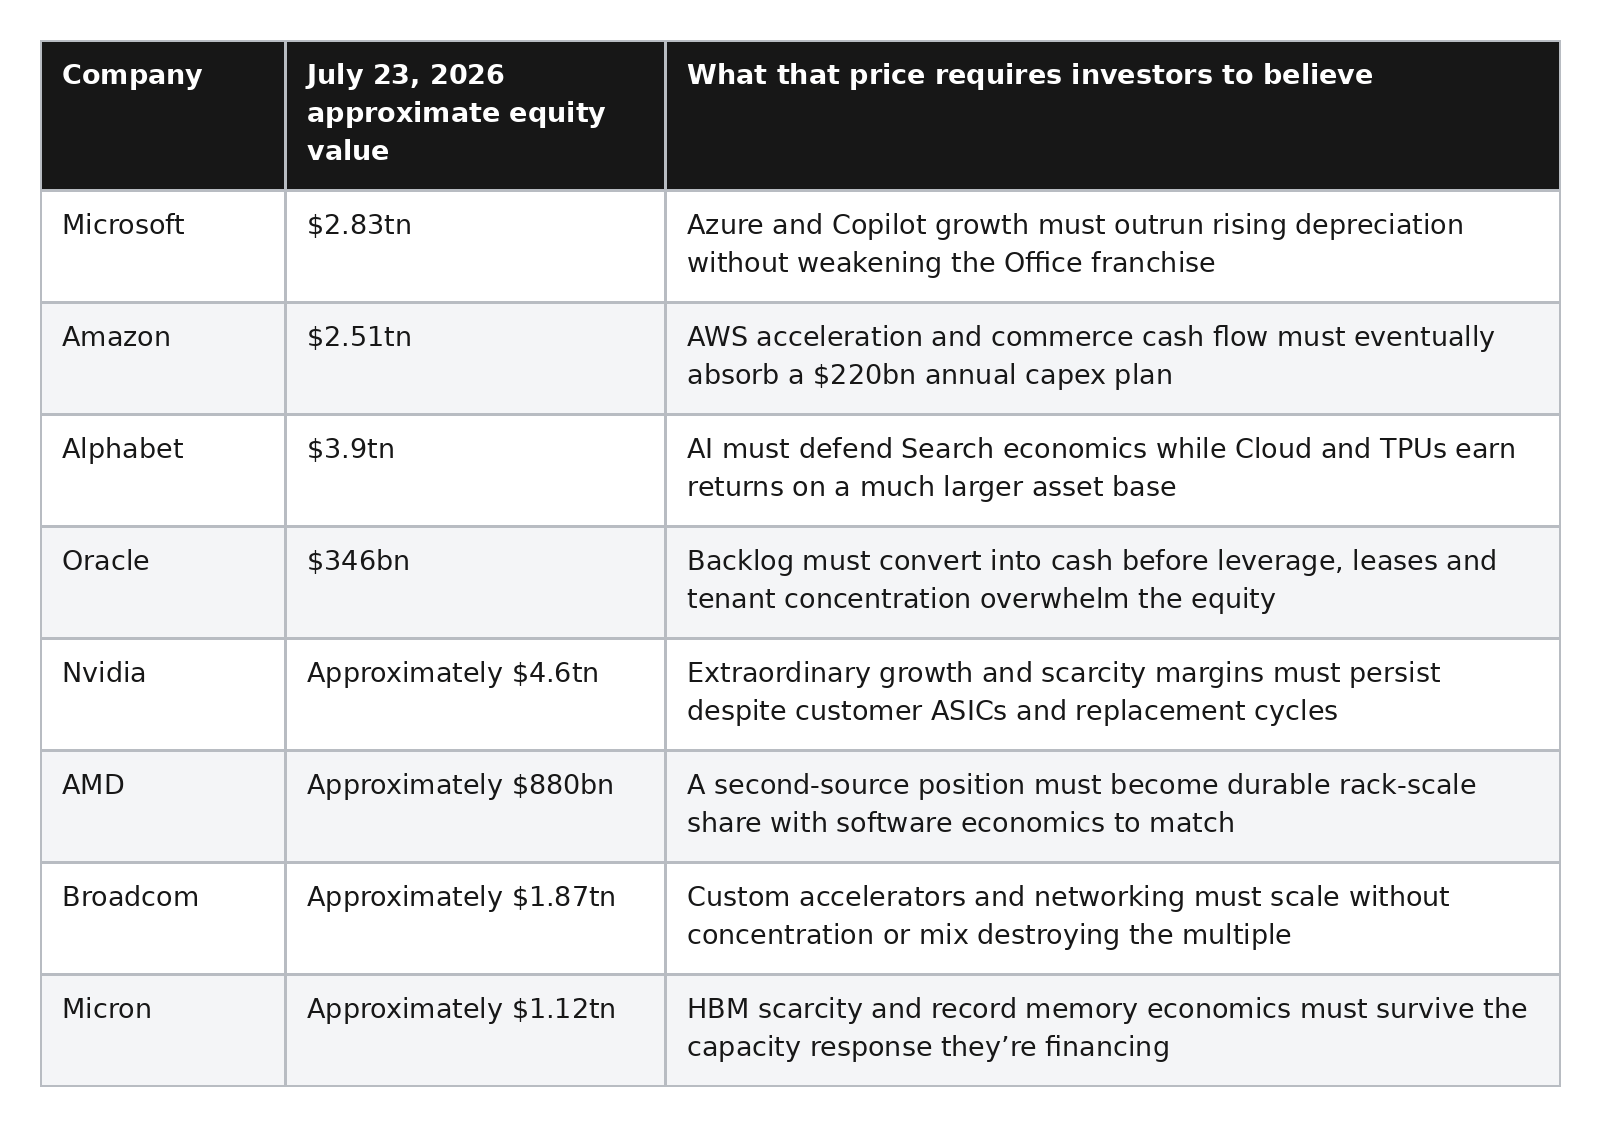
These equity values are approximate third-party market records, useful as a common-date price lens rather than primary accounting evidence. The price panel uses the same market-cap methodology and measurement date for Microsoft, Amazon, Alphabet, Oracle, Nvidia, AMD, Broadcom and Micron. These are pricing references, not primary accounting evidence.
This still isn’t a complete intrinsic-value model. A market cap doesn’t reveal the expected cash-flow path by itself, and a high multiple can be rational when growth and reinvestment returns are exceptional. It does force the correct investment distinction:


Amazon crossed $3 trillion of equity value on August 3, 2026, after this measurement date, illustrating why the price panel needs a fixed clock. The durable question is whether AWS cash generation and the rest of Amazon can justify its $220 billion 2026 capital-spending plan.
The Operating Evidence Behind the Valuations
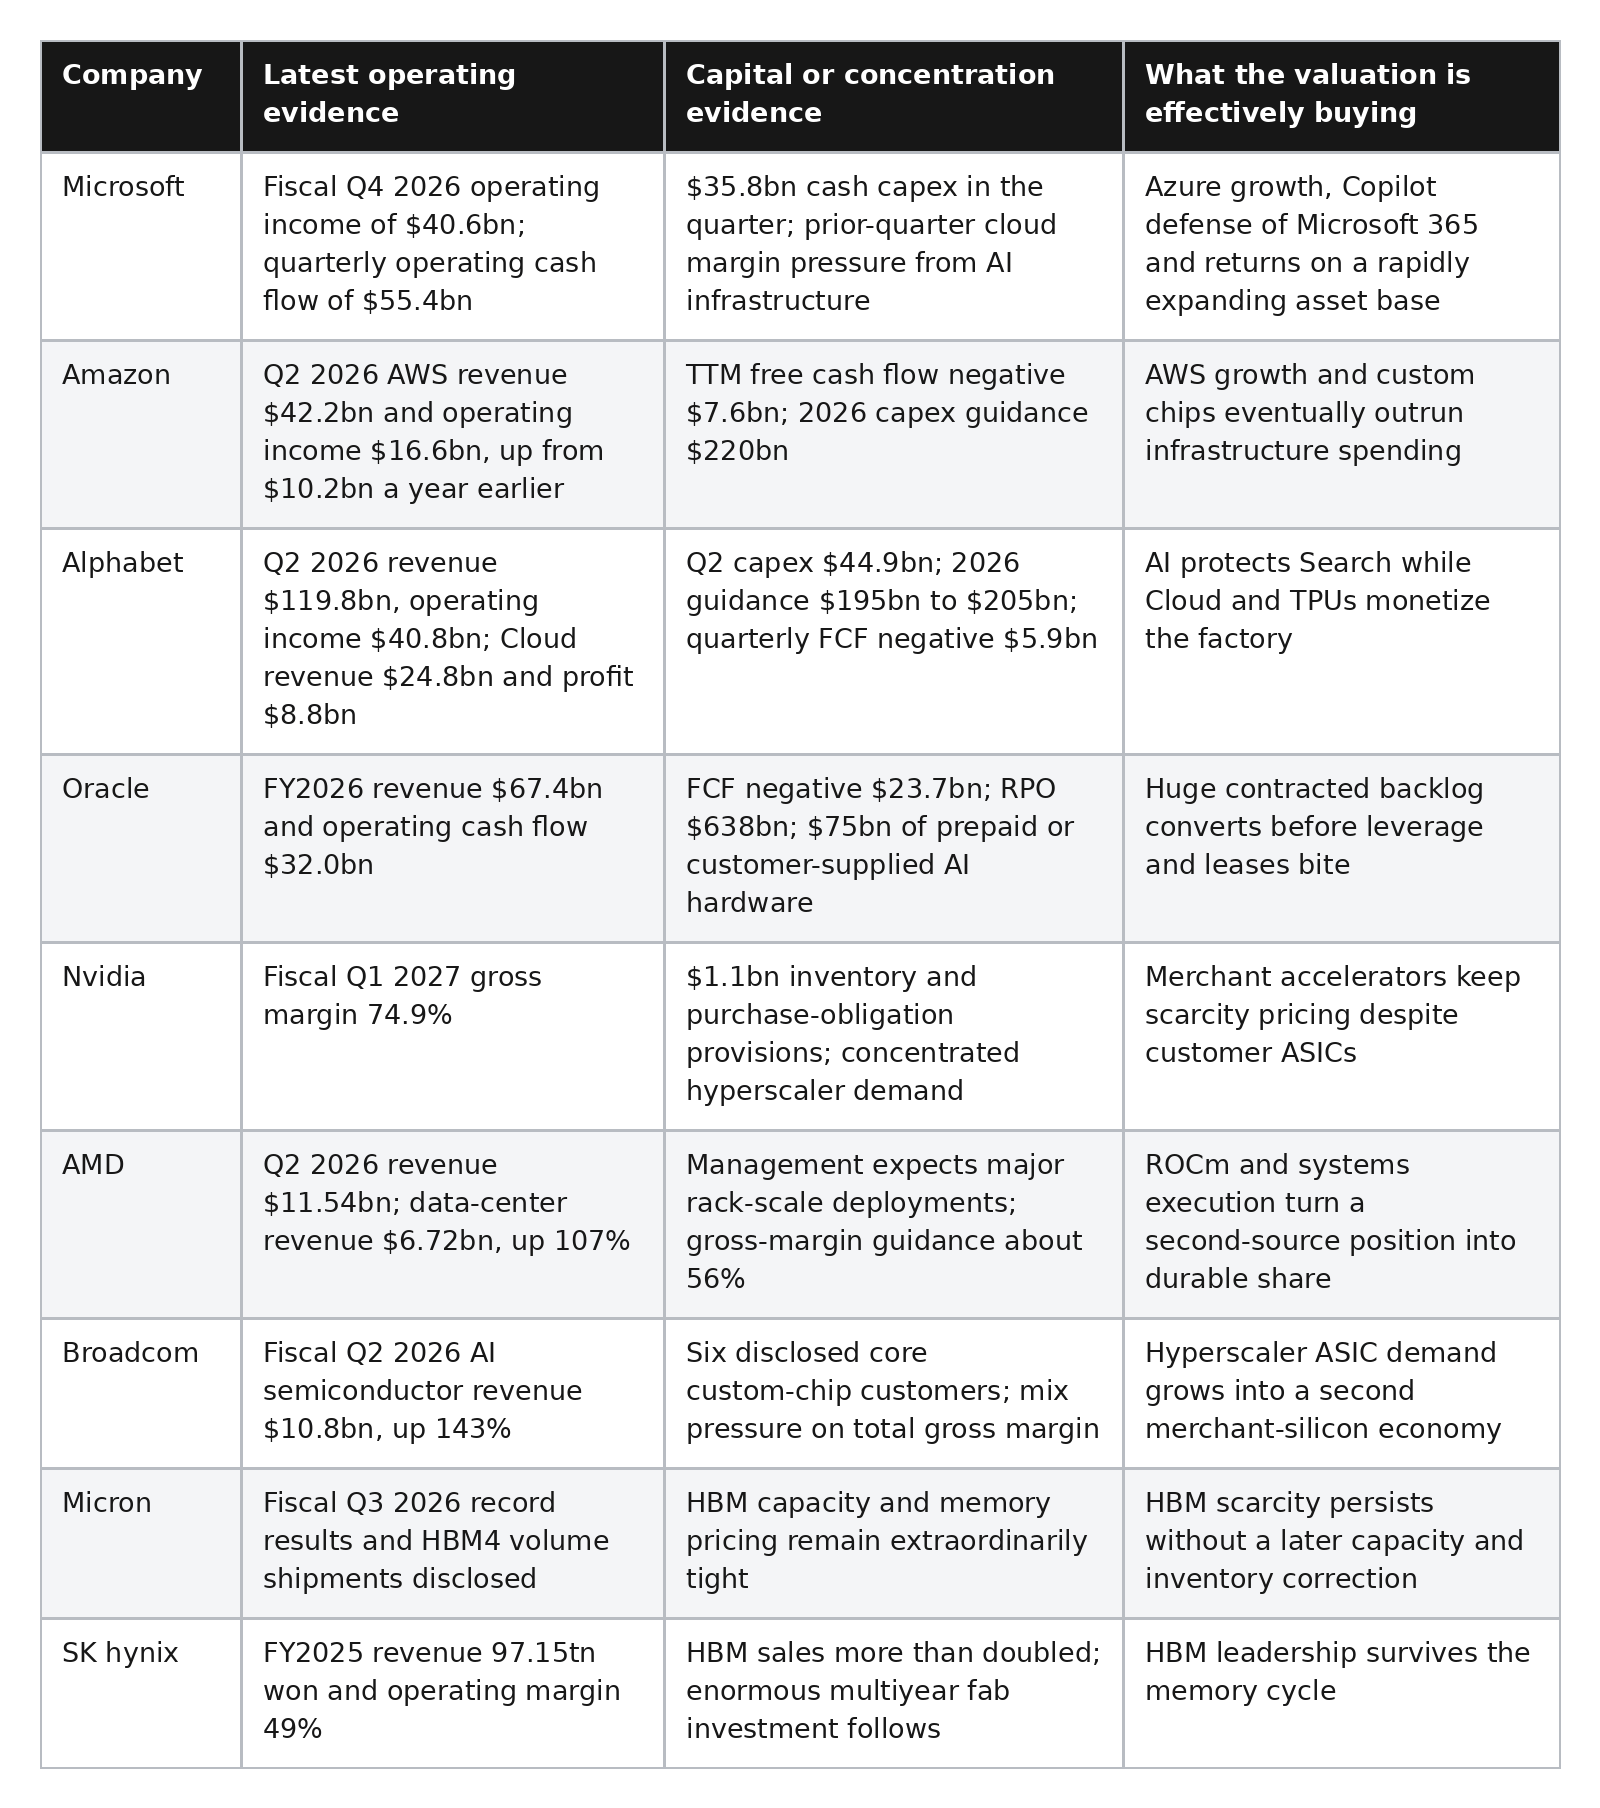
The entries are observed company results unless described as management guidance. Microsoft figures come from its fiscal Q4 report. Amazon and Oracle figures come from company releases, while Alphabet figures come from its Q2 release and call. Nvidia’s inventory and margin figures come from its Form 10-Q, and AMD’s Q2 data were reported by Reuters. Broadcom’s AI revenue is a company-provided result. Micron and SK hynix figures come from company releases. None proves AI-only return on invested capital because the required segment disclosures don’t exist.
The scoreboard also reveals why net income can mislead during a circular boom. Amazon’s Q2 2026 net income included $53.4 billion of non-operating pre-tax income, primarily from revaluing its Anthropic investment. Alphabet recorded $98 billion of other income, primarily unrealized gains on equity securities. Those marks are valid accounting events under the relevant rules, but they aren’t cash generated by renting compute. A lab’s rising private valuation can make its cloud investor report enormous earnings while both parties continue consuming cash to build the commercial relationship.
Nvidia’s best customers are also building the escape hatch
Nvidia’s moat isn’t just a fast matrix engine. It’s CUDA, libraries, networking, rack-scale design, developer familiarity and the ability to ship a supported system. That’s why a theoretically cheaper chip doesn’t automatically win. Customers compare completed-task cost, deployment time and software risk.
But scarcity rent creates its own enemy. If a hyperscaler spends $20 billion a year on merchant accelerators and believes a custom chip can lower equivalent workload cost 30 percent, the theoretical savings pool is $6 billion a year. That pays for an absurd amount of silicon design.

Google has TPUs. Amazon offers Trainium and Inferentia. Microsoft has Maia. Meta develops internal accelerators. Broadcom and Marvell sell the design, networking and intellectual property required to turn those ambitions into hardware. Broadcom said fiscal Q2 2026 AI semiconductor revenue reached $10.8 billion, up 143 percent year over year, driven by custom accelerators and AI networking. Management also identified six core custom-chip customers and warned that the mix toward rapidly growing AI semiconductors diluted total-company gross margin relative to software. That’s company-provided segment commentary, not evidence that custom chips have already displaced Nvidia broadly.
Custom silicon wins where workload volume is enormous and relatively predictable. A TPU or Trainium deployment can remove general-purpose features, optimize memory and interconnect around internal software, and avoid an external supplier’s margin. Merchant GPUs win where flexibility, time to market, frontier performance and ecosystem compatibility matter. The market can support both:

This segmentation changes Nvidia’s risk. The threat isn’t that every customer leaves. It’s that hyperscalers reserve Nvidia for the highest-performance workloads while moving the stable high-volume middle onto internal silicon. Nvidia keeps the glamorous frontier and loses some of the workload that amortizes the customer’s factory.
Direct customer count isn’t economic independence
Semiconductor filings report customers invoiced directly. Economic concentration can be higher. A server manufacturer, distributor and cloud provider can all appear as separate customers while the same frontier lab or cloud buildout drives their purchases.

Counting invoices at the bottom doesn’t create independent demand at the top. The right stress test asks how much supplier revenue ultimately depends on the same hyperscaler capex budgets, anchor labs and token-growth assumptions.
The HBM cycle begins at the moment shortage feels permanent
HBM uses vertically stacked DRAM dies connected through through-silicon vias and placed close to the accelerator through advanced packaging. The finished supply chain is a relay race:

A perfect GPU die without qualified HBM is inventory. Perfect HBM without packaging capacity is also inventory. Nvidia’s Blackwell generation shifted advanced-packaging demand toward TSMC’s CoWoS-L process while Hopper continued using CoWoS-S, illustrating how a bottleneck can change form rather than disappear.
HBM also consumes disproportionate wafer capacity. Micron said HBM3E required roughly three times as much wafer supply as DDR5 to produce the same number of bits on the same node, with later HBM generations expected to raise the trade ratio. That means an HBM boom tightens ordinary DRAM too. It also means every capacity decision has opportunity cost.
The cycle looks harmless while everyone is sold out:
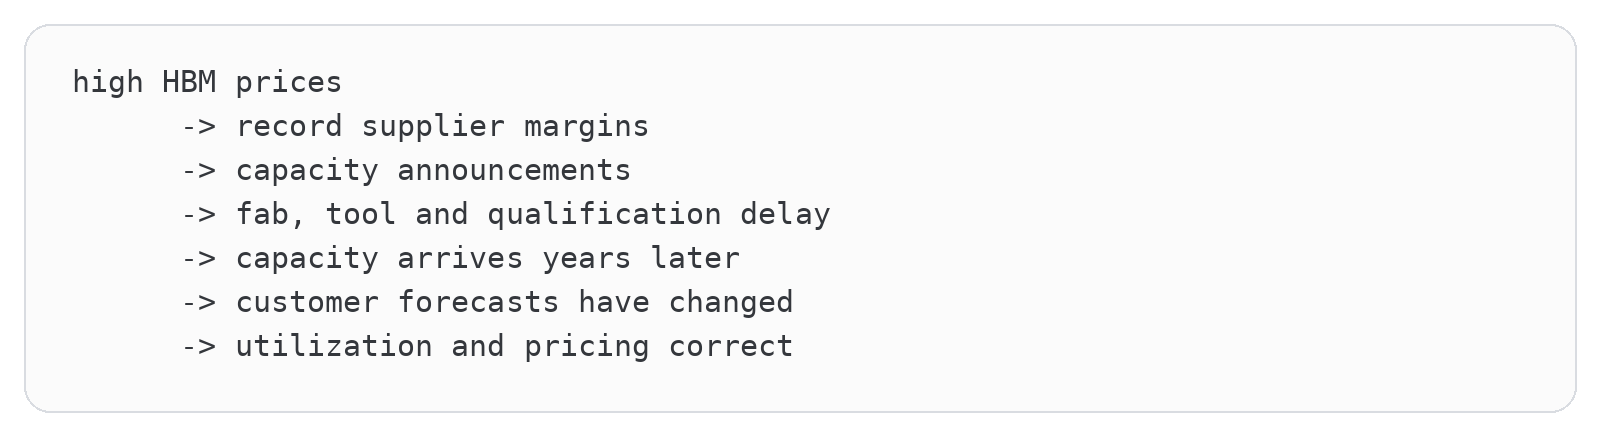
SK hynix approved $38.3 billion of additional Korean manufacturing investment through 2031 in August 2026, with the relevant cleanrooms arriving years after the board decision. That’s observed investment approval, not proof of future oversupply. It demonstrates the lag. The memory supplier must decide today what model demand, accelerator architecture and competitive capacity will look like when the cleanroom opens.
The bull case is structural scarcity, higher HBM content per accelerator and long-term agreements that discipline supply. The bear case is familiar memory physics: high fixed costs, slow capacity response and brutal pricing when supply finally exceeds revised demand. The scarce supplier can earn extraordinary margins today while helping make the lab’s task economics worse. Both statements can remain true until the cycle turns.
Atlas is the point where these public-market bets become one physical object. Its accelerator invoice becomes Nvidia revenue, its memory content supports HBM pricing, its network becomes supplier backlog, its electricity contract supports utility investment and its financing becomes a private-credit asset. One construction decision can appear as growth at six public and private layers before Atlas has completed a single customer task. That is why counting revenue down the stack doesn’t tell us whether six independent sources of demand exist. They may be six claims generated by the same anchor tenant.
Chapter 8: The Laboratories
This is where the private-company numbers get slippery
This is where the labs become the whole game. A frontier lab can promise to consume compute years before every future enterprise task has produced collected cash. That makes OpenAI and Anthropic more than glamorous software companies. Their revenue assumptions help support cloud backlog, infrastructure construction and supplier orders all the way down the stack.
So the bear case can’t be that OpenAI and Anthropic have no demand. They obviously do.
The real question is why some of the fastest revenue growth in corporate history hasn’t yet liberated frontier AI from enormous capital consumption.
OpenAI represents one side of the problem. It has staggering usage and revenue growth, but it also has staggering compute requirements. The optimistic interpretation is that the company is investing far ahead of demand and will eventually produce extraordinary margins. The pessimistic interpretation is that capital consumption isn’t merely a temporary growth expense. It’s an intrinsic property of manufacturing increasingly capable intelligence.
Reuters reported that OpenAI generated approximately $13 billion of revenue during 2025 while spending roughly $8 billion. It expected about $600 billion of cumulative compute spending through 2030 and more than $280 billion of revenue in 2030. Reported inference expenses quadrupled during 2025, contributing to a decline in adjusted gross margin from 40% to 33%.
Be careful with those numbers because they don’t all describe the same period or accounting concept. Cumulative compute spending through 2030 can’t be divided casually by revenue in one future year. Spending can support future customers, training and owned capacity. Revenue projections can compound sharply near the end of the forecast.
Still, they let us draw the central question.
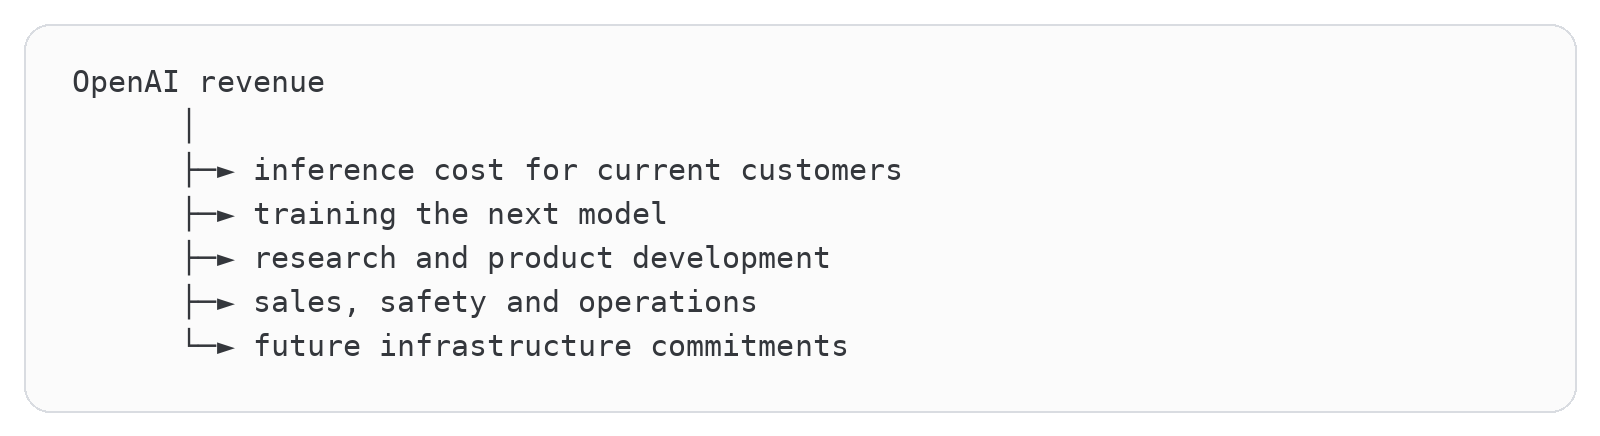
Traditional gross margin asks how much revenue remains after delivering the current product.
Frontier AI complicates the boundary because the next product is partly necessary to defend the current one. If OpenAI stopped training more capable models, competitors could erase its premium. Some research spending therefore behaves like optional growth investment, and some behaves like the cost of remaining in business. The distinction is crucial:

If training expense eventually stabilizes while a durable model serves expanding demand, margins can improve dramatically.
If each generation is quickly matched, distilled or commoditized, the laboratory must spend billions again merely to recreate a temporary lead.
OpenAI then resembles a pharmaceutical company whose patent expires every year, except the next drug also requires a new power plant.
Anthropic appears closer to the counterexample because its enterprise-heavy business can generate much better unit economics. But its model creates a different vulnerability.
Anthropic’s reported growth has been extraordinary. Reuters reported in October 2025 that the company was targeting a $9 billion annualized revenue run rate by year-end and projected between $20 billion and $26 billion for 2026. Claude Code alone had approached a $1 billion run rate.
Annualized run rate is useful for a rapidly growing business, but it isn’t annual recognized revenue.
If a company produces $750 million during December, multiplying that month by twelve produces a $9 billion run rate. The calculation tells us the speed at the finish line. It doesn’t mean the company collected $9 billion during the race.

Neither number is dishonest. They answer different questions. Run rate asks, “How fast are we moving right now?” Recognized revenue asks, “How far did we actually travel?” Gross profit asks, “How much remained after delivering the service?” Free cash flow asks, “After the entire machine consumed cash, what was left?”
Every serious analysis of Anthropic needs to keep all four numbers separate.
Anthropic isn’t simply raising its published price per token every generation. Recent frontier generations have broadly maintained their price bands. That’s the important point. While underlying compute should become cheaper over time, Anthropic is attempting to preserve the market price of frontier intelligence while encouraging longer sessions, more reasoning, more agent calls, premium speed tiers and deeper integration into enterprise workflows.
Chapter 9: OpenAI
OpenAI has three businesses hiding in one income statement
OpenAI’s consumer subscription, enterprise/API business and frontier research machine should be mentally separated even when private-company reporting doesn’t provide audited segment accounts. The consumer business converts a fraction of a vast free audience into monthly subscriptions. The enterprise business sells seats, API consumption and workflow infrastructure. The research machine trains the models and creates the capability both commercial businesses sell.
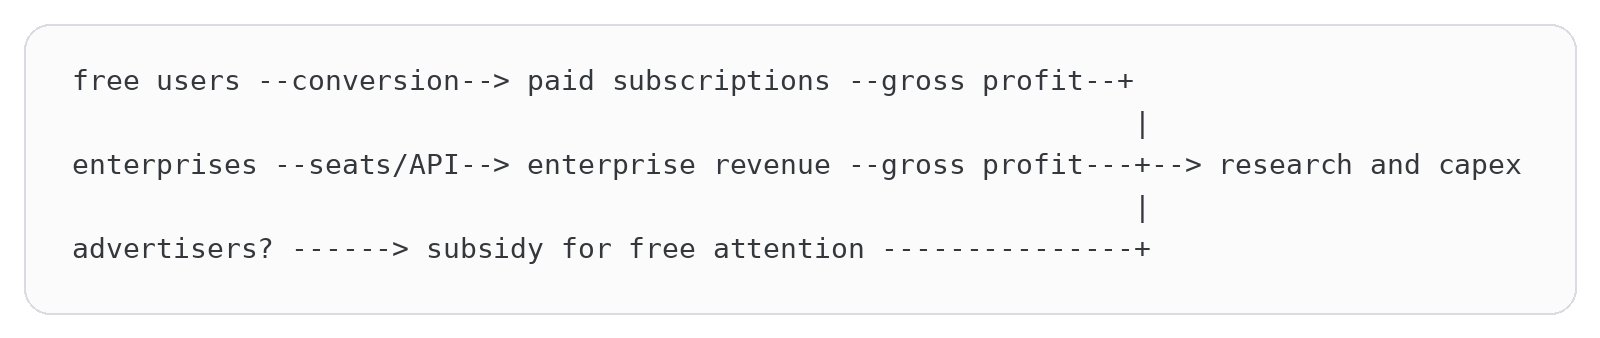
Each engine has a different test. Consumer economics depend on paid conversion, retention and serving cost per user. Enterprise economics depend on task value, reliability, security, integration and price competition. Research economics depend on how long a capability lead lasts and whether the resulting models generate enough gross profit before the next training cycle.
Reuters reported that OpenAI’s recognized 2025 revenue was $13 billion, above a $10 billion internal projection cited by the source. That is a full-year flow, unlike the company’s annualized run-rate milestones during the year. Reuters also reported that OpenAI expected cumulative compute spending of roughly $600 billion through 2030 and 2030 revenue above $280 billion, divided approximately evenly between consumer and enterprise units. Those are management plans relayed by sources, not audited forecasts.
The gap between gross margin and cash burn tells us which question each number answers. Gross margin asks whether revenue covers direct serving cost. In Q1 2026, documents reported by The Information put revenue at $5.7 billion, cost of revenue at $3.5 billion and gross margin at 39 percent. Reuters separately reported $3.7 billion of quarterly cash burn and said it couldn’t independently verify the underlying report. If the gross-margin figures are comparable:

That’s genuine economic progress at the delivery layer. The Information’s reported figures, also summarized by Reuters, put Q1 research and development expense at $8.6 billion, including model training, and operating loss at $9.3 billion including $2.3 billion of share-based compensation. Gross profit can be positive while the frontier treadmill consumes far more.
Stock compensation isn’t current cash, but calling it free would be cute accounting. It transfers value through dilution. Training expense may create an asset-like future benefit, but accounting usually expenses research because success and useful life are uncertain. Cash burn adds another distinction because customer prepayments, compute credits, financing and working capital can make cash timing differ from operating loss. For a private company with complicated partner agreements, every number needs its label attached like luggage at an airport.
Advertising could become the subsidy that closes the consumer equation. Reuters reported in April 2026 that internal projections contemplated roughly $2.5 billion of advertising revenue in 2026 and $100 billion by 2030. These were reported projections, not recognized results. The strategic logic is obvious: hundreds of millions of nonpaying users create attention, and advertising monetizes users who won’t buy subscriptions.
But ads don’t repeal inference cost. They change who pays. Suppose a free user costs $1.20 per month to serve and generates $0.80 of ad gross revenue. The user is still contribution-negative by $0.40 before R&D and overhead. If better targeting raises ad revenue to $1.80, the free tier contributes $0.60. Now increase agent usage threefold and serving cost to $3.60. The subsidy breaks again. The relevant ratio is:

OpenAI’s paid-conversion assumptions therefore matter enormously. If 900 million weekly users convert at 5 percent to an average $25 monthly net subscription, that simple hypothetical produces $13.5 billion a year. At 10 percent, it produces $27 billion. The arithmetic is illustrative, not an estimate, and weekly users aren’t the same as unique monthly billable accounts. It shows why one percentage point of conversion can be worth billions and why consumer enthusiasm alone doesn’t reveal profitability.
The business becomes self-financing only when operating gross profit covers research, sales, administration, interest, working capital and the capital expenditures or leases needed to sustain growth. A useful milestone ladder is:
What OpenAI Has to Prove Before the Model Self-Funds
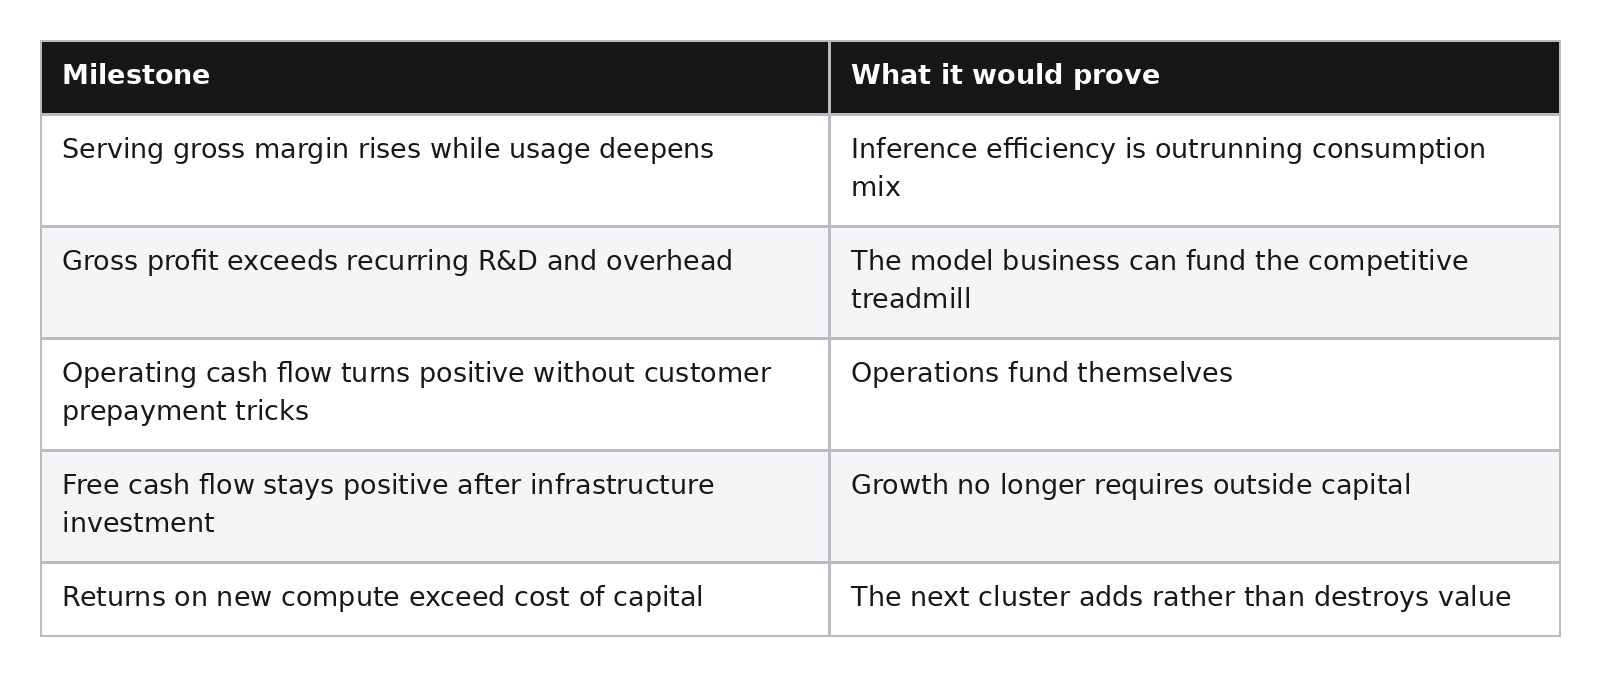
OpenAI doesn’t need SaaS-like gross margins tomorrow. A fast-growing infrastructure-heavy business can rationally consume cash. The thesis fails if margins improve, capital intensity falls per useful task, conversion deepens and each compute cohort earns attractive returns before obsolescence. It strengthens if revenue keeps exploding while the capital required before self-financing explodes faster.
Three OpenAI futures, with the labels left on
OpenAI’s reported 2030 revenue target doesn’t tell us what gross margin, recurring research cost or cash infrastructure burden accompanies it. We can still put the missing variables on the whiteboard without pretending somebody left OpenAI’s spreadsheet in our inbox. The following are our own scenarios, not management forecasts or analyst estimates. They show what has to be true for a reported $280 billion revenue year to become an economic success.
Three Ways OpenAI’s 2030 Math Could Land
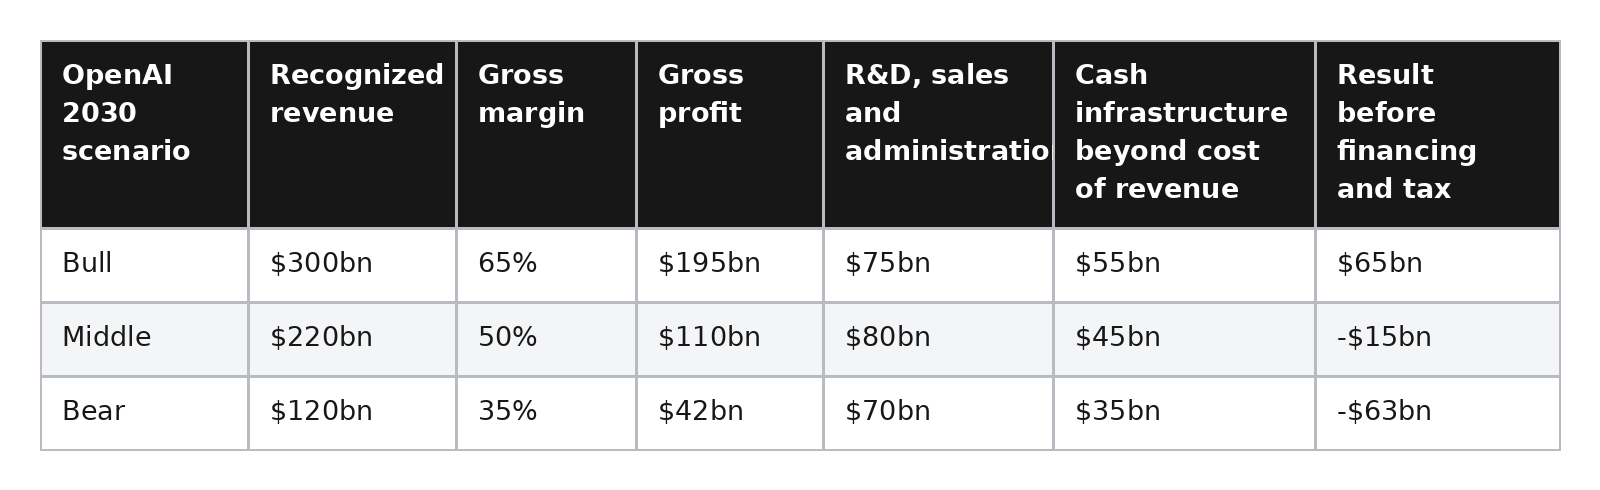
The bull scenario requires something close to software-like delivery economics despite agentic workloads, while research and capital spending rise much more slowly than revenue. The middle scenario produces extraordinary revenue and still consumes cash because the laboratory remains on the capability treadmill. The bear scenario isn’t “nobody uses ChatGPT.” It’s a $120 billion business whose price, serving cost and competitive investment never line up.
Advertising changes the revenue column, not the laws of arithmetic. Paid conversion changes consumer revenue. Custom silicon and inference optimization change gross margin. A slower frontier race changes R&D. Owned infrastructure and leases change capital timing. The model works when those improvements arrive together.
An investor can update the table quarterly with five observations:

If revenue and gross margin rise while R&D growth, burn and incremental commitments decelerate, the bull path is becoming real. If revenue grows while the other four demands grow just as quickly, scale hasn’t yet produced self-financing economics.
For Atlas, these scenarios aren’t an abstract debate about a private-company valuation. Imagine the project’s cloud operator has reserved 45 percent of Atlas for an OpenAI-like anchor tenant. In the bull scenario, the tenant’s gross profit increasingly funds the reservation, its credit quality improves and Atlas can refinance against a customer that no longer depends on repeated equity infusions. In the middle scenario, the tenant may keep paying while outside capital remains available, but Atlas’s lender is underwriting both AI demand and the willingness of future investors to bridge the laboratory’s cash deficit. In the bear scenario, even a $120 billion laboratory can be a dangerous anchor tenant if serving costs, research and infrastructure commitments leave it structurally cash hungry. Atlas doesn’t need the tenant to disappear. A request for lower pricing, shorter contract duration or less reserved capacity is enough to change the project’s equity math.
Chapter 10: Anthropic
Anthropic is the cleaner enterprise experiment
Anthropic’s enterprise weighting makes it the strongest natural objection to the claim that frontier economics are broken. Reuters reported in October 2025 that more than 300,000 business customers generated about 80 percent of Anthropic’s revenue, with an annualized run rate approaching $7 billion at the time. Claude Code had reached nearly a $1 billion annualized run rate. Again, run rate annualizes the current pace. It isn’t cumulative recognized revenue, gross profit or free cash flow.
Enterprise concentration is both a strength and a risk. Businesses can spend far more than consumers because the value ceiling is a labor or revenue budget, not an entertainment subscription. They also negotiate, route workloads, demand service credits and notice when one workflow suddenly eats a small intern’s salary in tokens. Concentration among large customers makes sales efficient but gives buyers leverage at renewal.
Claude Code makes the consumption mechanism visible. A coding agent doesn’t merely answer a question. It reads repositories, searches, edits, tests, retries and sometimes delegates. Cost per active developer is therefore:

Monthly cost depends on active days and the distribution’s fat tail. Ten light developers and one agent running a migration around the clock don’t average like eleven ordinary seats. Flat per-seat plans invite heavy users to consume more than the price covers. Strict metering protects Anthropic’s margin and sends budget shock to the customer. Hybrid limits split the unhappiness elegantly.
Anthropic also has a multi-cloud hedge that doubles as a commitment problem. Amazon and Google provide capital, specialized chips and enormous capacity. Reuters reported in May 2026, citing The Information, a $200 billion five-year commitment involving Google Cloud and TPUs, while Alphabet’s investment and the deal deepened the commercial relationship. The reported commitment allegedly represented more than 40 percent of Google Cloud backlog. Terms, conditions and ramp schedules weren’t publicly disclosed, so treating $200 billion as an unconditional bill due evenly is unjustified.
This creates a useful stress test. If Anthropic’s $30 billion annualized pace eventually became $30 billion of durable recognized revenue, a $40 billion average annual Google commitment alone would still be larger, before AWS, Nvidia, people and ordinary costs. That division is intentionally crude because the reported commitment can be back-loaded, conditional and support future scale. The point isn’t that Anthropic is currently insolvent. It’s that reported cloud headlines embed extraordinary growth assumptions, and the public terms are too incomplete for confident margin arithmetic.
Operating-profit forecasts need similar care. An “adjusted operating profit” that includes training but excludes stock compensation isn’t net income or free cash flow. If employee equity is a large part of compensation, dilution is a real investor cost. If cloud payments are prepaid or financed by a strategic investor, cash timing can flatter or punish a quarter without changing lifetime economics. We should demand a bridge:
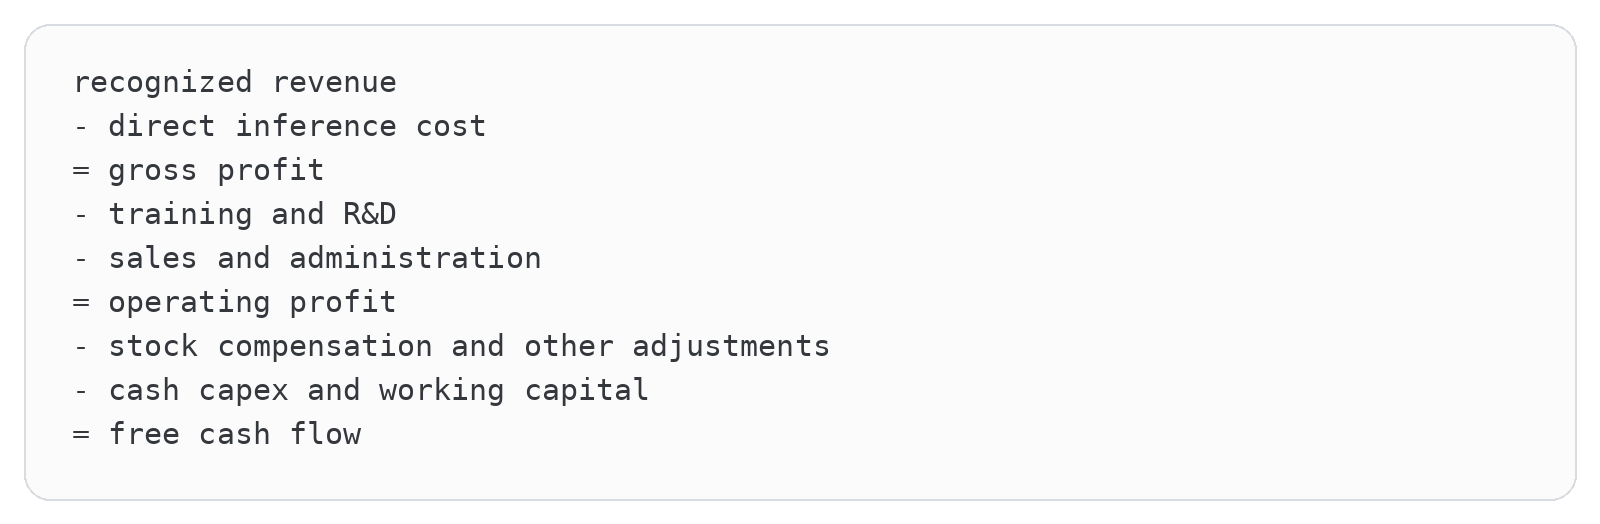
Until Anthropic publishes audited statements, reported financials remain partial views. That uncertainty isn’t proof of bad economics. It’s a reason not to turn a run rate into a margin and a margin into cash with two enthusiastic sentences.
Catch-22 one: Claude needs to eat the payroll without eating the customer
Anthropic’s enterprise ceiling is labor value. If Claude helps 100 engineers produce the work of 130, the customer can justify a large bill. Initially the bargain can satisfy everyone: the backlog shrinks, revenue grows and nobody leaves. But if customer demand grows only 5 percent while productive capacity grows 30 percent, the unused capacity eventually appears in hiring plans.

The customer can preserve 100 employees by inventing enough valuable projects. Anthropic would love that because more projects consume more Claude. If the customer can’t, the easiest ROI proof is roughly nineteen avoided or removed positions. Claude captures a slice of the labor budget and validates the product, but repeated labor compression eventually reduces the number of human seats around which usage was originally organized.
That’s the first Catch-22. Anthropic needs sufficiently large labor savings to support a growing bill. Yet the easiest substitutions are finite. After routine drafts, tests, documentation and support work are automated, remaining tasks have more ambiguity, accountability and downside. They often require senior review, domain context and insurance against error. Marginal automation value can decline while marginal inference cost rises because the hard tasks use longer context and reasoning.
The counterargument is strong: software demand is nowhere near saturated. Lower development cost could cause every department and small business to build custom tools, creating far more total coding. If induced demand outpaces productivity, developer employment and Claude consumption can both rise. Evidence for that bull case would be accelerating software investment, startup formation and project counts alongside stable or rising engineering hiring. Evidence for the compression case would be project output rising while entry-level openings, contractor use and team sizes fall.
Catch-22 two: intelligence must get cheaper to make, but not cheaper to buy
Anthropic wants production cost per useful task to fall rapidly:

It wants customer willingness to pay for the completed work to remain tied to value:

The difference is gross profit. But competitors see the same margin pool. Distillation, open weights, custom silicon and routing push market price toward the next-best alternative. If market price falls faster than internal cost, gross margin contracts even as technology improves:
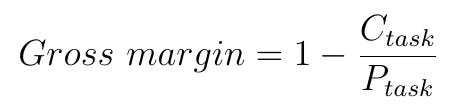
Start with a $10 task costing Anthropic $4 to serve, a 60 percent gross margin. Efficiency halves cost to $2, but competition cuts price to $3. Margin falls to 33 percent. The model is cheaper to manufacture and less profitable. Now imagine Claude remains the best but only receives hard tasks after cheap models handle the routine 90 percent. Those residual tasks require more tokens, more tools and more failed attempts. Anthropic keeps the prestige and inherits the ugly workload mix.
Value-based pricing is the answer if Anthropic owns a differentiated outcome. A model that reliably completes a $50,000 migration can charge much more than its tokens cost. But value-based pricing requires measurement, trust, responsibility and some protection from rivals. If another model completes the same migration for $5,000, the customer’s value didn’t change, yet Anthropic’s price ceiling did.
Anthropic’s economics are proven when recognized revenue converts to durable gross profit, adjusted profit survives the restoration of stock compensation, free cash flow covers cloud and training commitments, customer concentration declines and premium task volume remains robust despite routing. They fail if run-rate growth outruns cash temporarily while the frontier premium and ordinary-task volume erode from below.
Anthropic’s routing sensitivity
Anthropic’s problem is easier to visualize as 100 units of enterprise work. Let the initial system send all 100 to Claude at an average price of $10 per successfully completed task and a serving cost of $4. That produces $1,000 of revenue and $600 of gross profit before training, sales, stock compensation and cloud minimums.
Now let routing move routine work elsewhere. The remaining Claude tasks are harder, so their price and serving cost both rise.
How Routing Pressure Changes Anthropic’s Economics
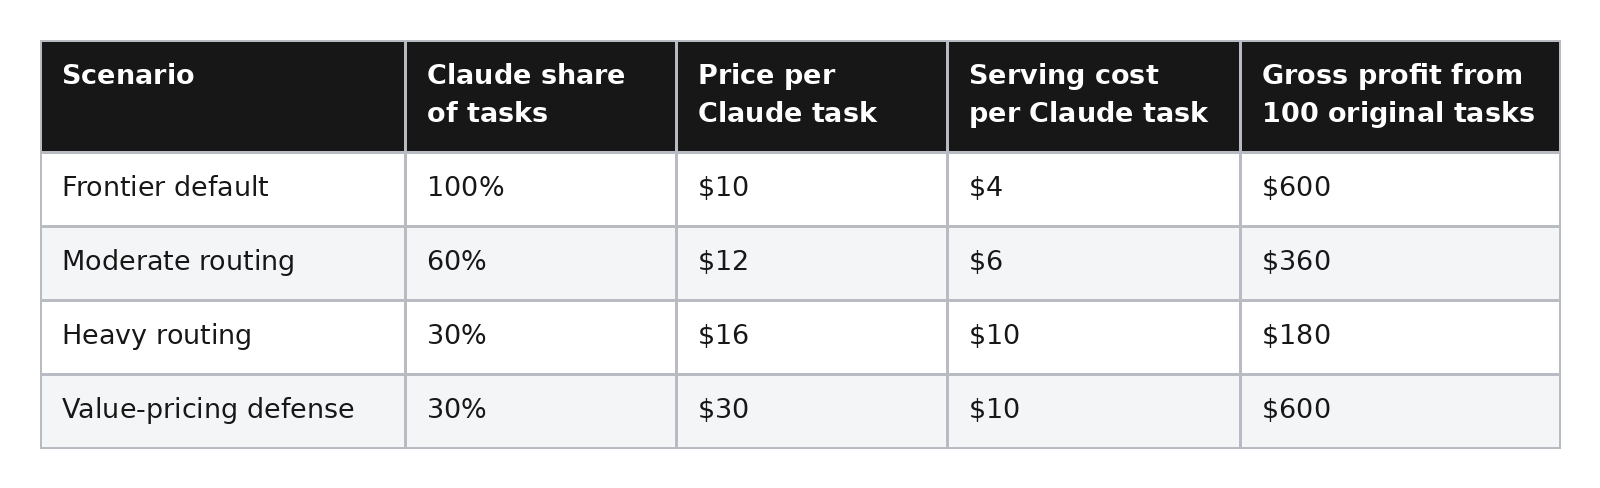
These are hypothetical units, not Anthropic financial data. They isolate the strategic variable. Under heavy routing, Claude can become more expensive, handle more valuable work and remain the undisputed best model while gross profit associated with the original workload falls 70 percent. Value-based pricing restores the economics only if Anthropic captures $30 for a task competitors can’t complete reliably.
Add fixed frontier investment (F) and contractual cloud minimums (M):

where (N) is total customer tasks, (s) is Claude’s routed share, (P) is price per task and (C) is serving cost. Anthropic can compensate for a falling share if total tasks explode, the frontier premium expands or serving cost collapses faster. That’s the strongest bull case. The Catch-22 appears when routing takes the easy volume while the remaining tasks consume longer reasoning traces and more expensive infrastructure.
Cloud commitments make the downside less smooth. If capacity purchases are fully variable, Anthropic’s costs fall with routed share. If contracts contain minimums or take-or-pay provisions, volume can fall before cost does. Public reporting doesn’t disclose enough terms to calculate that exposure, which is precisely why headline commitment totals shouldn’t be treated as either guaranteed cloud revenue or guaranteed lab insolvency.
Atlas experiences routing as a physical change in workload mix. When routine requests move to cheaper models or older hardware, its newest accelerators may retain the longest contexts, strictest latency requirements and most failure-prone agentic work. That can protect premium pricing, but it can also lower batch efficiency and increase cost per accepted task. If Atlas instead loses the work entirely, utilization falls. The apparently software-level decision to send a request to Claude, a distilled model or an internal system therefore becomes a choice about which rack earns the next dollar.
The falsification test is clean. The Catch-22 weakens if Anthropic retains premium volume, raises completed-task value, lowers serving cost and converts recognized revenue into free cash flow despite multi-model routing. It strengthens if Claude’s benchmark lead persists while its share of routine enterprise tokens falls, average task complexity rises and cloud commitments remain sticky.
The frontier price plateau matters more than the old price cut
It’s tempting to compare a recent Claude model with Claude 3 Opus and announce that frontier pricing collapsed from $15 per million input tokens and $75 per million output tokens to a much lower level. That comparison is historically true but strategically misleading if several subsequent frontier generations remain in the same price band.
The relevant question for Anthropic’s current economics isn’t whether it once cut price. It’s whether each new frontier generation must become cheaper than the model it replaces.
Think of a staircase that turned into a landing:
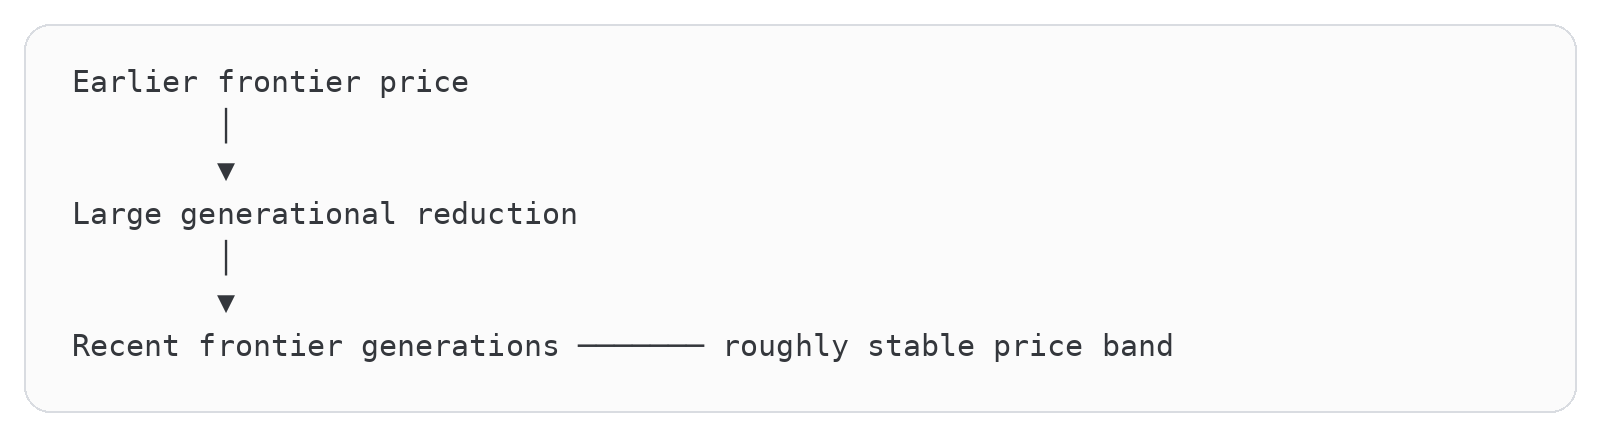
That landing is exactly what Anthropic needs. Capability improves, internal inference efficiency improves, but the posted value of premium intelligence doesn’t fall at the same rate. The difference becomes potential margin.
The danger is that the market may not respect the landing. OpenAI cut Luna pricing by 80% and Terra pricing by 20% in July 2026 while leaving its flagship Sol price unchanged. Luna input pricing fell from $1 to $0.20 per million tokens, and output pricing fell from $6 to $1.20. Terra moved from $2.50 and $15 to $2 and $12. Reuters reported that enterprise scrutiny of AI costs and competition from cheaper Chinese models contributed to the move.
This is the shape of a tiered price war:

At first, the frontier appears protected. But enterprises don’t send every task to the frontier. A router can ask a cheap model to classify difficulty, send routine work to Luna, Terra, Haiku, DeepSeek, Qwen or an internal model, and reserve Claude Opus for the nasty requests.
The flagship price can remain unchanged while flagship volume gets hollowed out from below.
A stable token price can still produce a rising customer bill
Now give one developer an agentic coding model.
During the first month, the developer uses 10 million input tokens and 2 million output tokens. Six months later, the same developer runs longer sessions, loads larger repositories, delegates to subagents and lets the system work overnight. Usage rises to 100 million input tokens and 20 million output tokens.
Nothing about the posted token price had to change.

If token volume rises tenfold while price remains fixed, the bill rises tenfold. Even if the price falls 50%, the bill still rises fivefold.

This is why saying “AI gets cheaper every year” can coexist with CFOs complaining that AI spending is exploding. The unit becomes cheaper while the product discovers ways to consume many more units.
Reuters described exactly this tension: falling token prices alongside rising and increasingly unpredictable task costs as companies shift from flat subscriptions toward metered usage.
Anthropic’s strategy therefore doesn’t require explicit annual price increases. It requires usage per valuable employee, workflow or task to rise faster than effective unit prices fall.
That’s a subtler argument than “Anthropic keeps raising prices,” and it’s much harder to dismiss because it matches how consumption businesses actually grow. Its strategy is less:

But the more important number is:

Anthropic isn’t really pricing Claude against ordinary software anymore. It’s pricing Claude against human labor.
Now put Atlas back underneath both laboratories. OpenAI and Anthropic don’t merely buy abstract “compute.” Their expected payments are what allow a cloud provider to reserve accelerators, sign power contracts and tell Atlas’s lender that future capacity has a customer. The laboratory sits between enterprise demand and the project’s debt service:
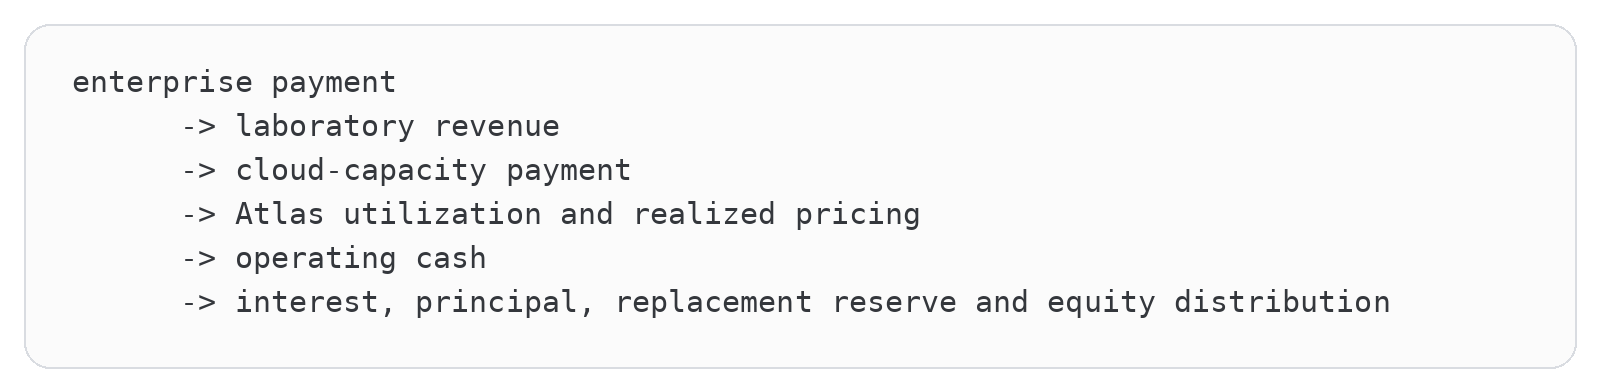
That chain turns the private-company accounting distinctions into infrastructure variables. Annualized run rate describes current commercial velocity. Recognized revenue describes work already delivered. Gross profit tells us how much survives serving cost. Free cash flow tells us whether the laboratory can fund its own expansion rather than returning to investors for another bag of money. Atlas’s lender cares about all four because an exciting run rate can support a construction story, but only collected and durable cash can service a long-lived obligation. The next question is therefore no longer whether enterprises want Claude or ChatGPT. They clearly do. It is where the enterprise obtains the payment that becomes laboratory revenue in the first place.
Part III: Follow the Value Back Up
Chapter 11: The Four Returns
The four places an AI dollar can come back from
Before claiming that AI spending leads to fewer jobs, we need to slow the argument down and put a little cash register on the table. A company spends a dollar on models, integration, data, consultants, security and the cheerful army of people whose job title now contains the word “transformation.” Where can the return actually appear? There are only four broad answers.
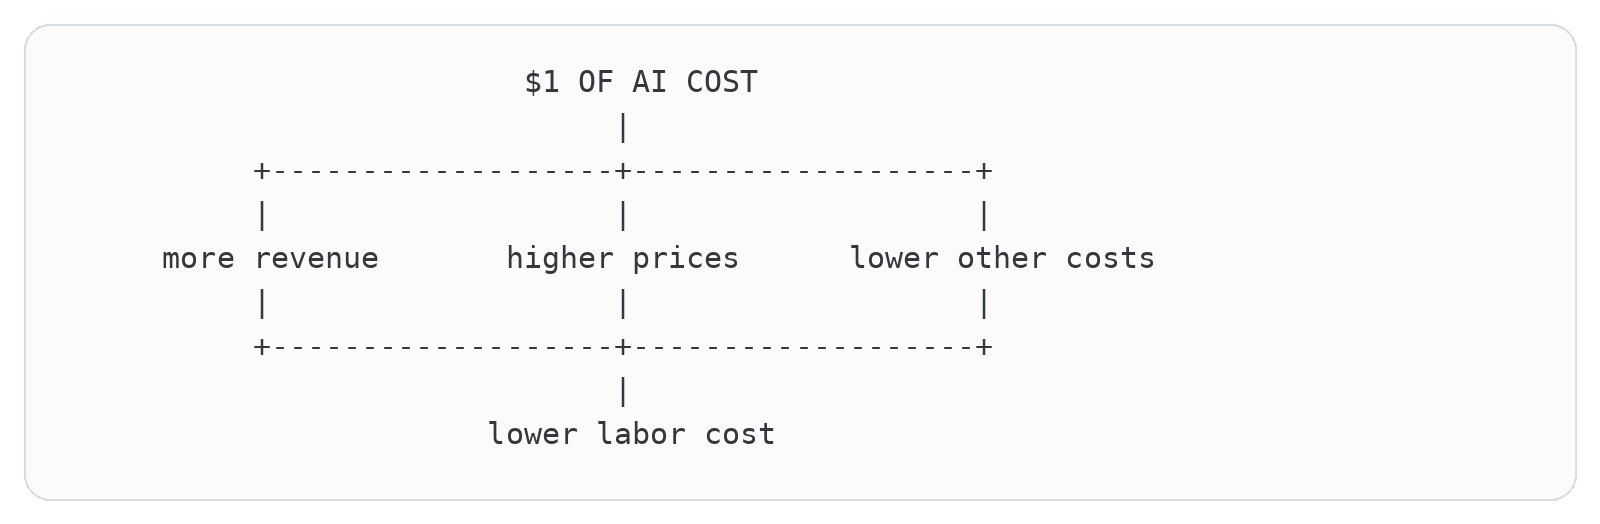
Write the annual value captured as three buckets, with the sales bucket containing the two ways revenue can expand:

And unpack the first term like this:

Then the investment works when:

This isn’t fancy corporate finance. It’s the lemonade-stand version, which is useful because the lemonade-stand version prevents us from hiding a bad result behind the phrase “strategic transformation.” AI can help a company sell more lemonade, charge more per cup, waste fewer lemons or schedule fewer people behind the counter. If none of those happens, the company has purchased a very impressive blender.
The four returns aren’t equally available. Raising prices is hard in competitive markets. Lowering electricity, rent, freight or raw-material cost with a language model is possible in particular workflows but not generally available to every firm. Additional revenue is the dream because it lets workers and shareholders win together, but revenue requires a customer on the other side of the transaction. The model can make a sales representative write twice as many proposals. It can’t make the customer need twice as much industrial adhesive. Labor cost is different. Management controls hiring, backfills, contractor budgets, spans of control and payroll directly. The savings can be booked before anyone proves that the market wants more output.
There is a more useful way to divide the same returns. Sales growth brings money into the company from customers. Lower labor and non-labor costs redistribute money already inside the company. Both improve profit, but they don’t tell the same economic story. Even “outside money” needs one more distinction, because a dollar can be outside one company without being new to the market as a whole.
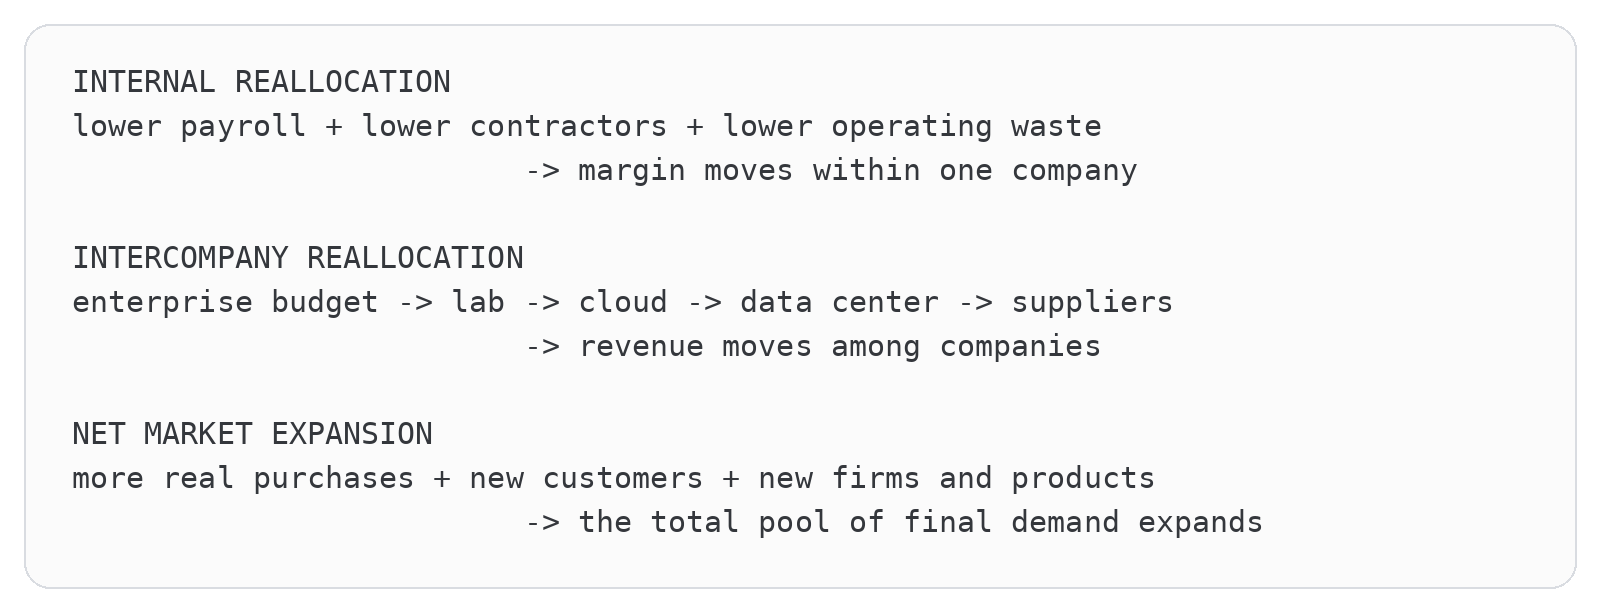
Internal reallocation can absolutely justify an AI purchase. If a company spends $10 million on models and permanently removes $15 million of annual cost, it has created a real $5 million recurring improvement before taxes and secondary effects. Nobody needs to pretend the saving is fake merely because revenue stayed flat. Intercompany reallocation is real too. The lab receives revenue, the cloud provider receives revenue from the lab and the power company gets paid by the data center. The problem appears when we mistake movement through the stack for expansion of the market beneath it. A finite cost base can support a recurring AI bill. It can’t support an AI bill that compounds forever unless the savings pool keeps expanding or net final demand eventually takes over.
Labor savings have a ceiling, even when they recur
Imagine a company with $50 million of payroll in work materially exposed to AI. Management believes it can eventually remove or avoid 30 percent of that cost without damaging service, leaving a maximum annual labor-saving run rate of $15 million. Now suppose its total AI bill starts at $10 million and rises 25 percent each year as agents handle longer workflows, use more tools and spread across the company.
A Finite Payroll Pool Cannot Fund a Compounding AI Bill Forever
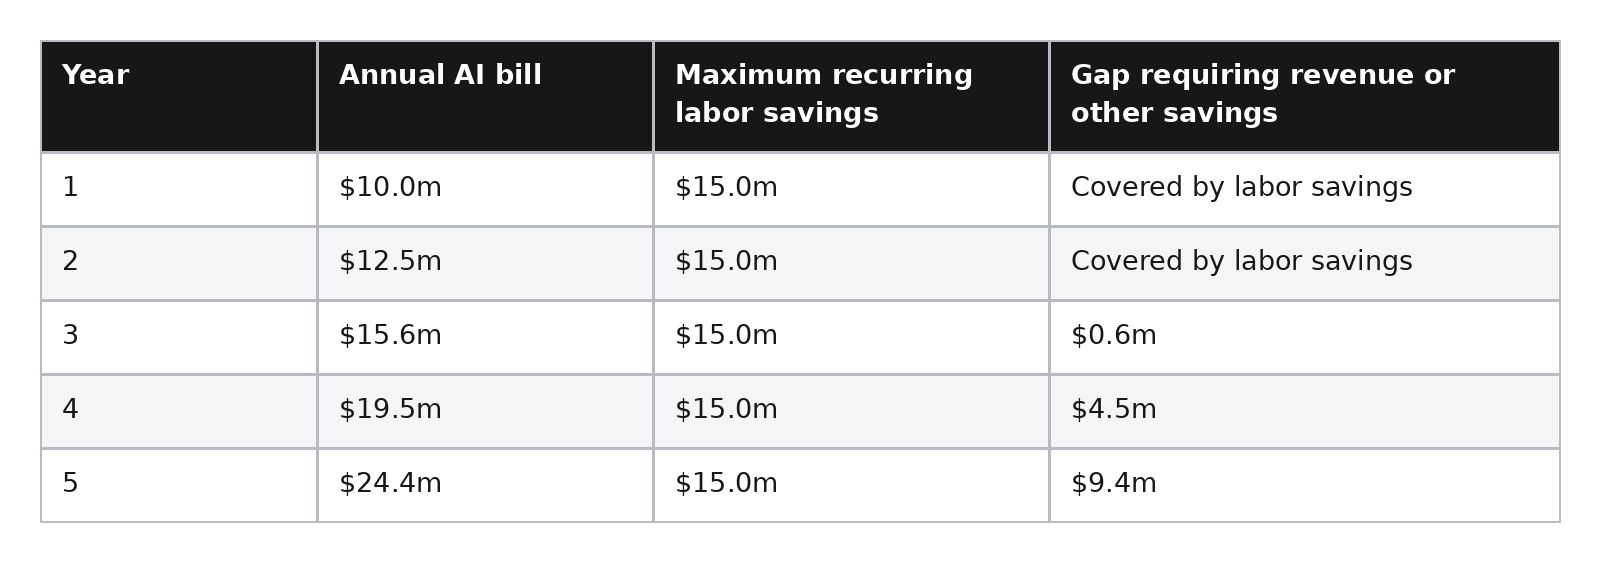
These are hypothetical assumptions, not a forecast. The point is the shape. The saved payroll repeats every year, which is why labor substitution can support meaningful recurring AI revenue. But the saving flattens once the target organization has been compressed. The AI bill can keep growing only if the company finds another cost pool, automates deeper into the remaining organization or starts earning more money from customers.
Write the limit as a very simple inequality. Let L₀ be the original exposed payroll and let a be the fraction management can remove or avoid without breaking the business. Then recurring labor savings can’t sustainably exceed:

The fraction (a) can be large. The initial payroll pool can be enormous. Neither fact makes the ceiling disappear. At the level of the whole market, continued AI-spending growth therefore requires some combination of deeper labor substitution, expansion into additional industries and genuine customer-revenue growth. The first two enlarge the payroll pool available for capture. Only the third proves that AI is making the broader economic pie grow fast enough to support the capital stack without continuously eating another expense line.
The ceiling tells us how much recurring savings labor can supply. It does not tell us how quickly a company reaches that ceiling. That depends on the gap between productive capacity and customer demand, which is the next variable Atlas needs us to examine.
Chapter 12: Capacity Is Not Demand
Capacity isn’t demand
Imagine a bakery with ten workers. Together they make 1,000 loaves a day, customers buy all 1,000 and everyone goes home smelling faintly of sourdough. Now give the bakery a machine that doubles output per worker. Productivity has doubled. Society has acquired the capacity to make more bread. We still don’t know what happens to employment because we haven’t asked how many loaves customers will buy.


Technology determines output per worker. Demand determines how many workers the market still needs. In the simplest version:

If productivity rises by 30 percent while demand rises by only 5 percent, required labor becomes:
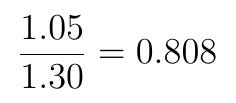
The business needs about 80.8 percent as much labor to produce the newly demanded output, a theoretical reduction of roughly 19.2 percent before new tasks, shorter hours, quality improvements, organizational friction or deliberate slack. This is not a forecast that every company fires exactly 19.2 percent of its staff. It is the pressure created when productive capacity outruns purchases.
Now turn the bakery into Atlas’s enterprise customer. It has 5,000 employees, $1 billion of annual revenue and $300 million of operating expense in AI-assisted work. Management spends $30 million on models and integration, and the same organization can produce 20 percent more code, support resolutions, campaigns and financial analysis. Hold demand constant:

The company can invent products, improve quality, shorten its backlog, cut prices enough to reveal new demand or reduce the resources assigned to the old workload. The first four require a customer or useful unmet work. The fifth requires an org chart. Employment remains stable only if sales expand enough, workers move into complementary tasks or management intentionally retains unused capacity. Quarterly capitalism is not famous for the final option.
Public companies rarely disclose the ratio between AI-enabled capacity and demand, but some disclose the decision rule. Shopify CEO Tobi Lütke told employees in April 2025 that teams requesting additional headcount had to demonstrate why AI couldn’t accomplish the proposed work. At a 2026 Wall Street Journal CFO event, Shopify’s CFO said headcount had remained roughly flat over the prior three years while annual revenue growth hovered around 30 percent. Shopify’s growth can’t be attributed entirely to AI, but the policy is explicit: automation gets first refusal on incremental work, and a human hire has to beat it.
At the same event, ServiceNow said its AI investments had produced $355 million of savings. Management said it reinvested about two-thirds and allowed roughly $125 million to reach the bottom line; the company reported $1.75 billion of 2025 net income, up 23 percent. This is a company-provided savings estimate reported by the Wall Street Journal, not an audited AI segment. It nevertheless shows the fork. Productivity can fund expansion, become profit or do some of both. It does not automatically become employment.
Atlas sees only the payment emerging from that fork. If the enterprise funds its $30 million AI bill with $30 million of incremental gross profit, its productive capacity found a market. If it funds the same bill by suppressing $30 million of payroll and contractor growth, Atlas receives identical cash this year but inherits a different long-term demand story. Customer gross profit can compound with the market. Cost removal eventually runs into the size of the expense line.
Revenue elasticity is the missing number
Economists describe part of this problem using demand elasticity. We can keep the intuition simple.
If AI lowers the effective cost of producing a service by 50%, do customers purchase twice as much, ten times as much or only 10% more?
For some products, lower cost reveals enormous hidden demand.
Affordable legal assistance could reach people who currently receive none. Custom software could become viable for tiny businesses. Personalized tutoring could expand far beyond families that can hire human tutors. Scientific analysis could be performed on experiments that currently remain untouched. For other products, demand may saturate quickly.
Does a company need ten times as many expense reports? Twenty times as many compliance summaries? Fifty times as many internal presentations? How many generic marketing emails can civilization survive before the sun refuses to rise? The employment outcome differs by category:
Whether AI Creates Jobs Depends on How Demand Responds
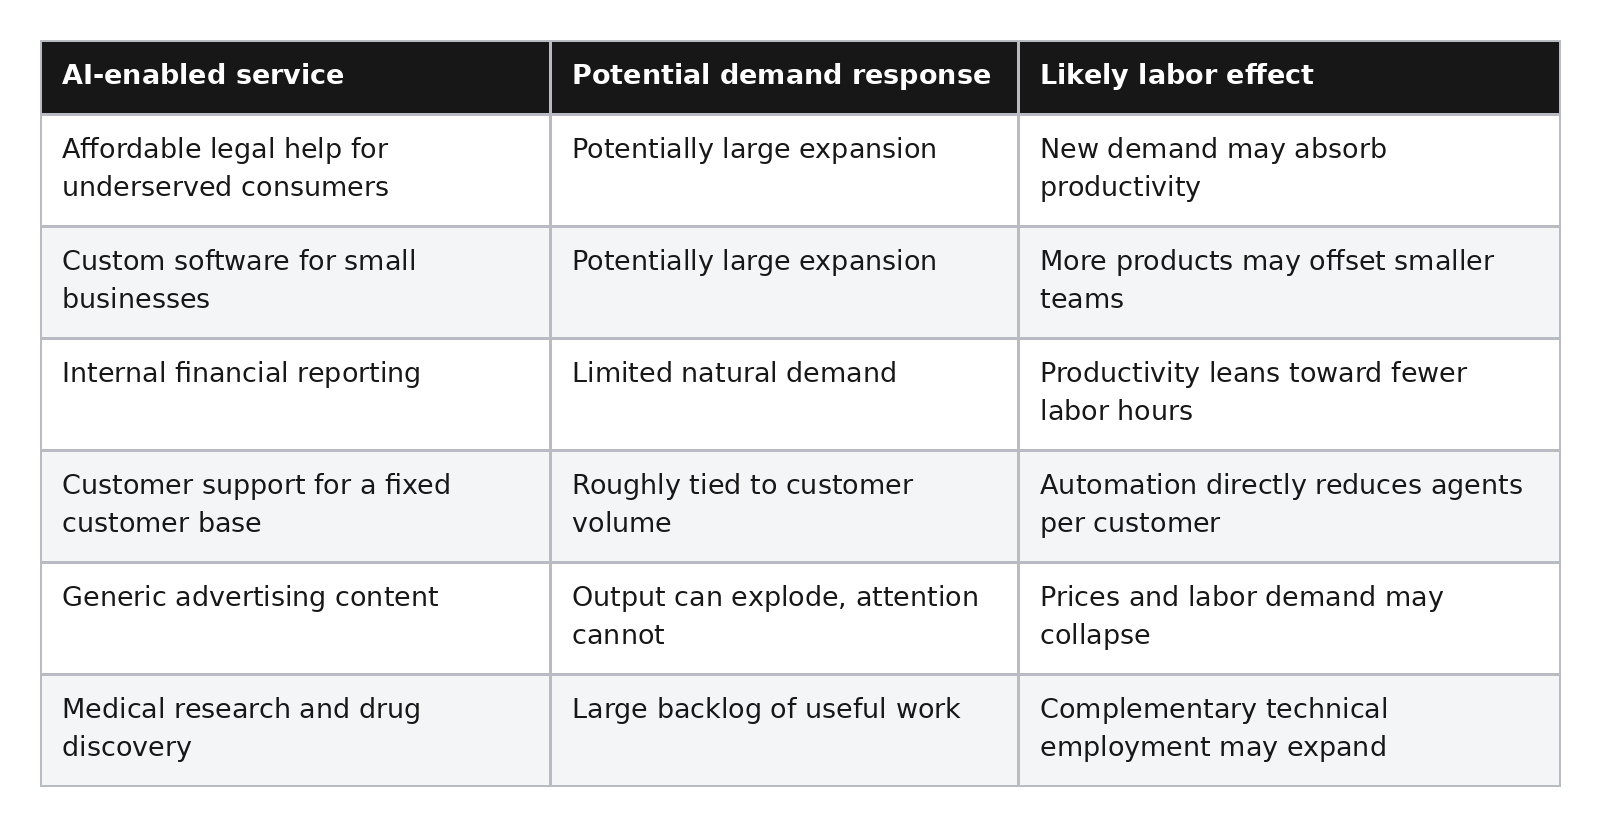
This is why “AI will make workers more productive” doesn’t answer the labor question.
It merely moves the question into the customer’s wallet.
Revenue per employee can rise for several reasons
Investors love revenue per employee because it looks like a clean productivity number:

But the fraction can rise because revenue went up, employment went down, contractors replaced employees, acquisitions changed the denominator, prices increased or the business mix shifted. AI may contribute without being the sole cause. That’s why a serious case study needs at least five lines: revenue growth, headcount growth, compensation expense, contractor or outsourced expense where disclosed and operating margin. A sixth line, customer count or transaction volume, helps separate price from quantity.
The cleanest theoretical signal isn’t mass layoffs. It’s a persistent wedge:

combined with management explicitly tying hiring approval, backfills or service capacity to automation. If revenue grows 15 percent while headcount stays flat and service levels hold, labor productivity has risen. That can be wonderful. If the company would previously have hired 1,000 people and hires 100, the economy experiences 900 missing jobs without a single terminated employee. The displacement happened relative to the counterfactual growth path.
This also explains why critics and pessimists can talk past each other. The critic points to positive payroll growth and says jobs aren’t being destroyed. The pessimist points to falling entry-level openings or non-backfilled roles and says AI is replacing labor. Both can be correct if total employment is still growing more slowly than output and if the composition of hiring is changing.
Chapter 13: Why Labor Is the Immediate Lever
The enterprise labor arbitrage
If an engineer costs a company $200,000 a year, spending $3,000, $10,000 or even $20,000 annually on Claude can look incredibly cheap if it substantially increases that engineer’s output.
It looks even cheaper if the company can avoid hiring another engineer. And if the system allows the company to eliminate or consolidate a position, its willingness to pay becomes much larger:

This is the bridge between frontier-model revenue and enterprise adoption. AI vendors can capture a piece of the payroll budget they help companies remove.
But the mechanism only preserves employment if the customer’s revenue grows rapidly enough to absorb the additional productive capacity.
Suppose AI raises a department’s productive capacity by 30 percent. If customer demand also rises by at least 30 percent, the company can preserve or expand employment. If demand rises only 5 percent, the organization has excess capacity and an immediate incentive to slow hiring or reduce headcount. That is the missing variable in most productivity arguments. Revenue expansion preserves labor. Productivity alone does not.
If customer revenue is not scaling with AI spending and AI-enabled capacity, labor becomes the easiest available path to margin capture. A company cannot force customers to buy 30 percent more software, legal work, accounting, advertising or support. It can decide not to backfill ten open positions. The revenue from an undiscovered product is theoretical. The salary removed from next quarter’s budget is not.
Companies are already chasing the savings
Corporate adoption data shows a strange combination of broad usage, shallow reorganization and intense pressure for efficiency.
McKinsey reported that 88% of surveyed organizations used AI in at least one function, while only 7% had fully scaled it. Although 62% were experimenting with agents, fewer than 10% had scaled agents in any individual function. Only 21% of organizations using generative AI said they had fundamentally redesigned at least some workflows. Yet workflow redesign was the organizational practice most strongly associated with a measurable earnings effect. The picture looks like this:
Companies Want Productivity, but They’re Budgeting for Cost Reduction
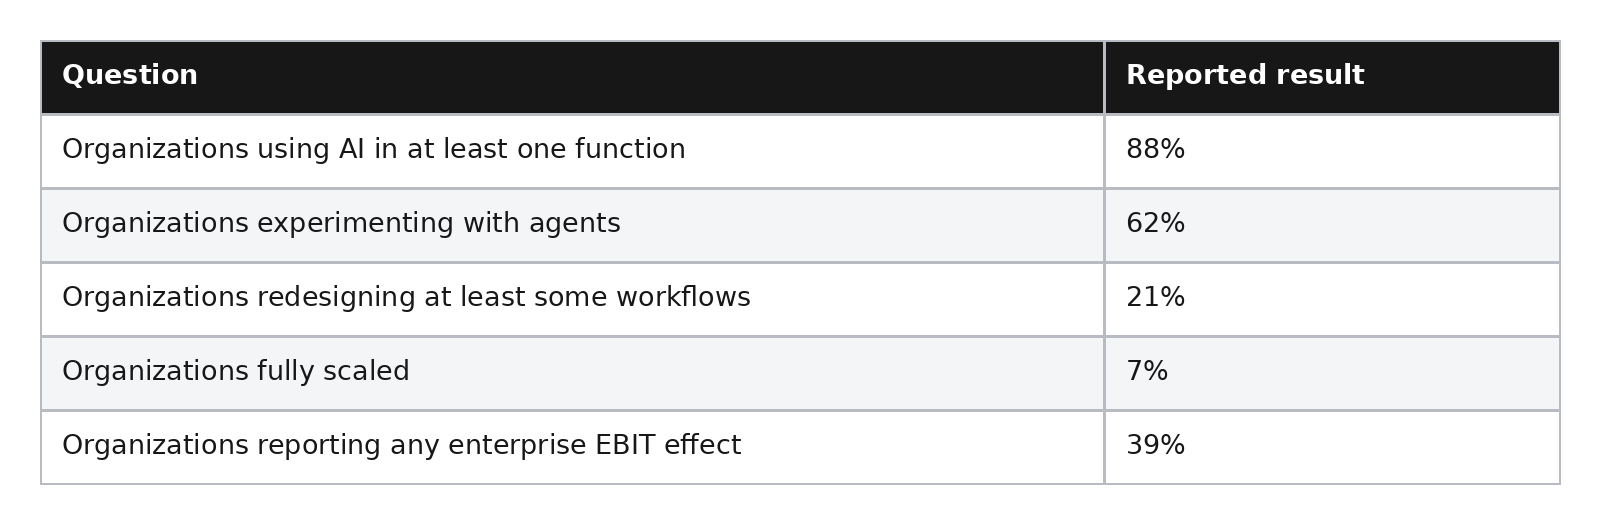
AI is simultaneously widespread and shallow. Companies have bought the capability much faster than they’ve redesigned themselves around it. That means they’re still deciding whether the future employee is a domain expert using one copilot, a manager supervising several agents, a verifier checking autonomous work, a generalist combining four former jobs or simply the remaining employee after the department becomes smaller.
But the financial objective is already clear. McKinsey found that 80% of organizations had established efficiency as an AI objective. Gartner found that 42% of surveyed CFOs anticipated AI-driven headcount reductions in selling, general, administrative and support functions, while one-third expected reductions of between 1% and 5%.
Companies can identify the salary they might avoid much more easily than the revenue generated by a job category that doesn’t yet exist.
The future org chart is still a whiteboard. The margin target is already in the spreadsheet.
Meanwhile, Atlas’s financing clock keeps running. The enterprise doesn’t have to finish redesigning its organization before the laboratory bills it, and the laboratory doesn’t have to prove the customer generated new sales before paying for reserved cloud capacity. That timing advantage is what lets cost reduction finance the bridge. It is also why early Atlas utilization can’t, by itself, tell us whether the workload is supported by an expanding market or by a temporary harvest of existing expense lines.
Chapter 14: What the Evidence Actually Shows
Adoption is observable. Attributable revenue is much harder.
The best current evidence doesn’t show that AI produces no revenue. It shows that enterprise-wide financial value is much less mature than adoption. In McKinsey’s survey published November 5, 2025, 88 percent of respondents said their organizations used AI in at least one business function, but nearly two-thirds said their organizations hadn’t begun scaling AI across the enterprise. Thirty-nine percent reported any enterprise-level EBIT impact attributable to AI, and most of that subset said the contribution was below 5 percent of EBIT. Eighty percent said efficiency was an objective. These are survey responses, not audited financial statements, and respondents may interpret “attributable” differently. Still, the contrast between 88 percent using and 39 percent reporting any EBIT effect is useful evidence about the gap between access and monetization.
A separate McKinsey workplace survey published in 2025 found a more optimistic revenue picture among U.S. C-suite respondents: 58 percent reported some revenue increase from generative AI, including 39 percent reporting a 1 to 5 percent increase. But only 23 percent reported a favorable cost change. This is expectation-and-attribution data from executives, not a decomposition of recognized revenue in SEC filings. It tells us that executives perceive benefits. It doesn’t tell us how much of the revenue was incremental, whether it would have occurred anyway or whether the AI program earned more than its full cost.
The accounting problem is nastier than it sounds. Suppose a software company spends $100 million on AI and revenue rises from $5 billion to $5.4 billion. Sales leaders credit better targeting, product leaders credit new features, finance credits pricing and the CEO credits “our AI-first culture,” because apparently causality is elected by committee. To claim $400 million of AI revenue, we need a counterfactual estimate of what revenue would have been without AI. That counterfactual doesn’t appear in a 10-K. An honest ROI bridge looks like this:
AI Adoption Is Easy to Measure. AI Revenue Is Not.
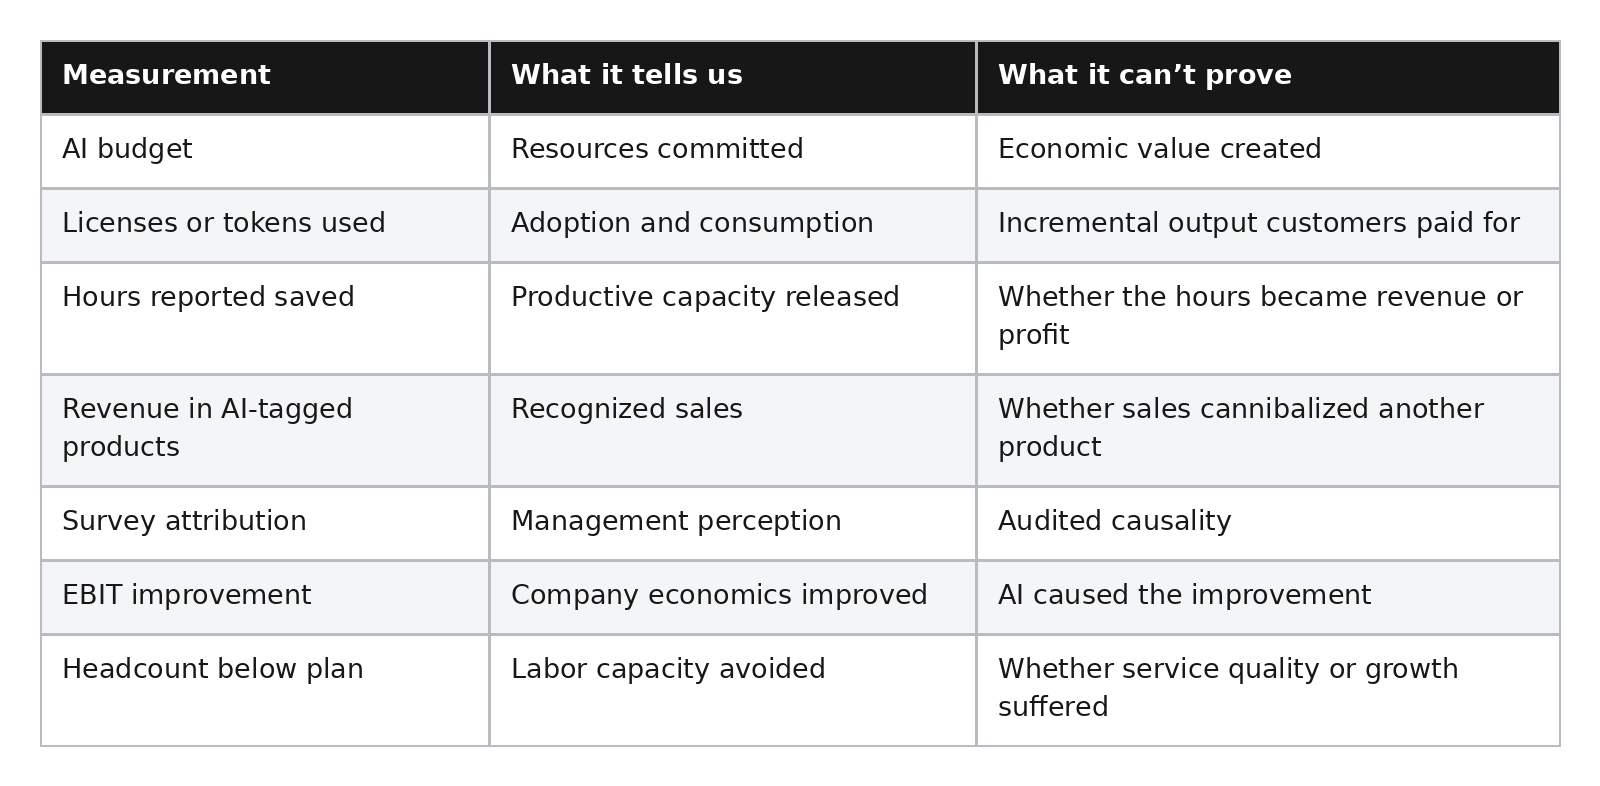
This is why “employees saved 10 million hours” isn’t yet a financial result. If those hours let the same people ship products customers buy, excellent. If they let employees attend eleven additional meetings about using AI, the economy has survived another productivity miracle without noticing.
The Census data says “early,” not “harmless”
Nationally representative Census research provides an important counterweight to breathless claims from both sides.
Census researchers found that between November 2025 and January 2026, 18% of firms reported using AI in a business function. Because adoption was concentrated in larger employers, those firms represented 32% of employment. Among very large firms in information, professional services and finance, usage reached roughly 50% to 60%, or 60% to 70% when weighted by employment.
Among adopters, 57% used AI in no more than three functions. Sales and marketing led at 52%, followed by strategy and business development at 45% and information technology at 41%. Sixty-five percent limited worker use to three or fewer task categories.
That’s what an early general-purpose technology looks like. It has penetrated the largest knowledge-intensive firms while remaining shallow across much of the economy.
The same paper found that 66% of users relied on AI solely to augment tasks, while only 2% of firms reported AI-related employment decreases. That is strong evidence against claiming that AI has already produced economy-wide mass unemployment.
It isn’t evidence that future displacement is impossible.
The more interesting result is that broader functional integration and operational investment were positively associated with employment decreases. Worker-level task use alone wasn’t significantly connected to lower headcount after accounting for deeper organizational deployment. In plain English:
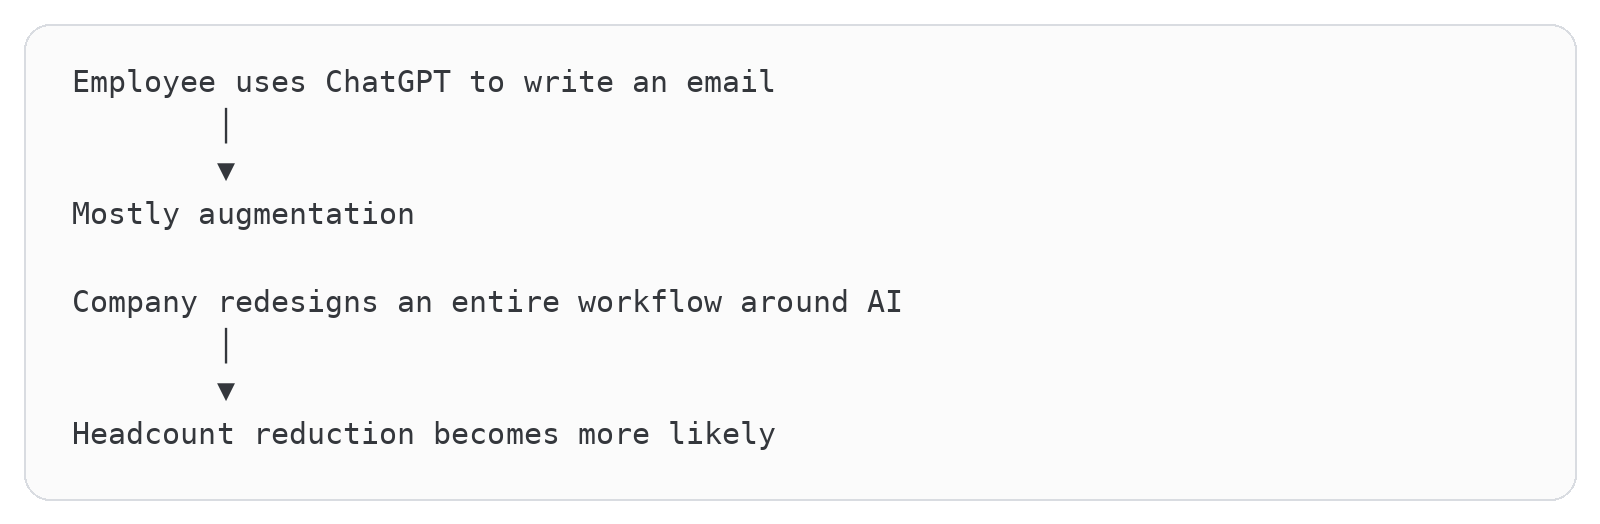
This explains why adoption statistics can look reassuring during the pilot phase. Giving thousands of employees copilots doesn’t automatically change the org chart. Connecting AI to the workflow, reorganizing responsibility and removing human handoffs does.
The employment effect may therefore lag tool adoption:

Using today’s 2% reported reduction rate as a permanent ceiling would be like examining online retail in 1997 and concluding shopping malls had nothing to worry about.
The correct conclusion is narrower: broad displacement hasn’t yet occurred across most firms, but the firms moving from individual assistance toward operational integration already show a different labor relationship.
What would prove the labor-margin claim wrong?
The labor thesis should be falsifiable. Over the next several years, it weakens if real revenue growth accelerates faster than AI-enabled capacity and headcount expands with output rather than lagging it. Entry-level hiring should recover, aggregate hours should remain firm and labor’s share of value added should hold or rise. Most importantly, AI-attributable gross profit should exceed the full cost of models and integration without workforce compression.
It strengthens if adoption and token consumption surge while attributable revenue stays modest, revenue per employee rises mainly through flat headcount, hiring rates fall before layoff rates rise, junior occupational inflows weaken and corporate earnings calls increasingly describe avoided hiring as productivity. None of those observations alone proves AI caused the change. Interest rates, post-pandemic overhiring, slower population growth, trade policy and ordinary cyclical weakness all matter. The claim is narrower: when AI creates more capacity than customers absorb, labor is the return lever management can pull most directly.
Chapter 15: Where Atlas’s Customer Gets the Money
Atlas finally has a customer at the end of the capital tower. Imagine an enterprise with 500 people in an AI-exposed function. Customer demand grows 5 percent, while AI raises the function’s productive capacity by 30 percent. The company also commits $20 million a year to models, cloud capacity, integration and supervision. That bill cannot be paid with “productivity” as an abstract noun. It has to return as additional revenue, higher prices, lower non-labor cost or lower labor cost.
If demand expanded with capacity, this would be the clean bull case. The company would produce 30 percent more useful work, sell almost all of it, retain its workers and happily increase AI spending. Atlas would be paid from new customer revenue. But when output demand rises only 5 percent, the amount of labor required to serve that demand changes:

That is not a forecast of 96 immediate layoffs. It is 96 positions’ worth of excess productive capacity under the assumptions. The enterprise can absorb it through new products, lower prices, better service, internal projects and reassignment. Whatever remains appears as fewer contractors, canceled requisitions, attrition, non-backfilling or layoffs. This is why the labor chapter belongs inside the Atlas story. Payroll savings are one of the sources from which the enterprise pays the lab, the lab pays the cloud provider and the cloud provider supports Atlas. The chain now runs in both directions:
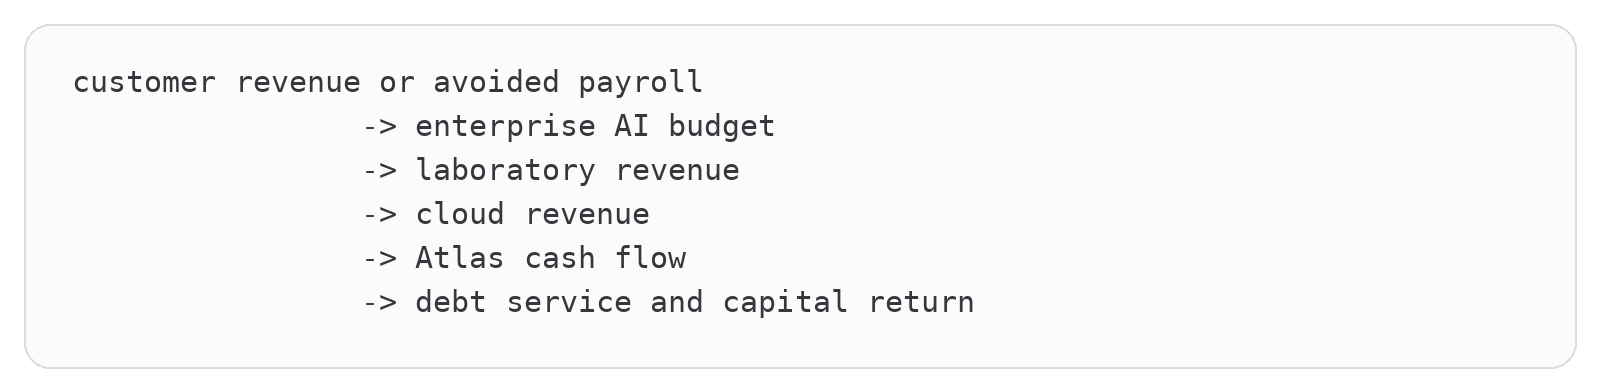
The physical factory has manufactured intelligence. The economic factory must now decide whether that intelligence expands the market or compresses the expense line.
To see how quietly this can happen, follow one renewal through the system. Atlas adds another enterprise workload. The laboratory records additional revenue. The cloud provider reports higher utilization. The data-center owner receives another capacity payment. The enterprise funds part of the renewal by approving fifteen new analysts instead of the thirty it once expected to hire. Nobody announces an AI layoff. Every financial layer above the enterprise reports growth while fifteen entry-level jobs simply fail to appear. Atlas has been paid, but the payment came from income that would otherwise have gone to workers who would also have become customers somewhere else.
That doesn’t make the transaction bad. If the enterprise lowers prices, invests the savings, launches a product or serves customers who were previously uneconomic, the value can return as new demand. But it explains why the next act has to examine people rather than merely another income statement. Labor is both an expense available for immediate compression and a source of purchasing power required by the economic factory.
Part IV: The People Funding the Bridge
Chapter 16: How Economies Have Escaped Before
The first mistake is looking only for layoffs. A company that expected to grow from 70 employees to 100 but now plans to operate with 75 has displaced 25 positions relative to its old path without terminating 25 people. The change appears as fewer entry-level openings, missing backfills, reduced contractor hours, slower headcount growth and longer job searches. That makes the labor evidence harder to read, not less economically real.
Three labor claims that shouldn’t be thrown into one blender
The labor argument becomes stronger when it admits what the data can’t yet prove. There are three levels of confidence.
What the Labor Data Proves, Suggests and Cannot Yet Establish
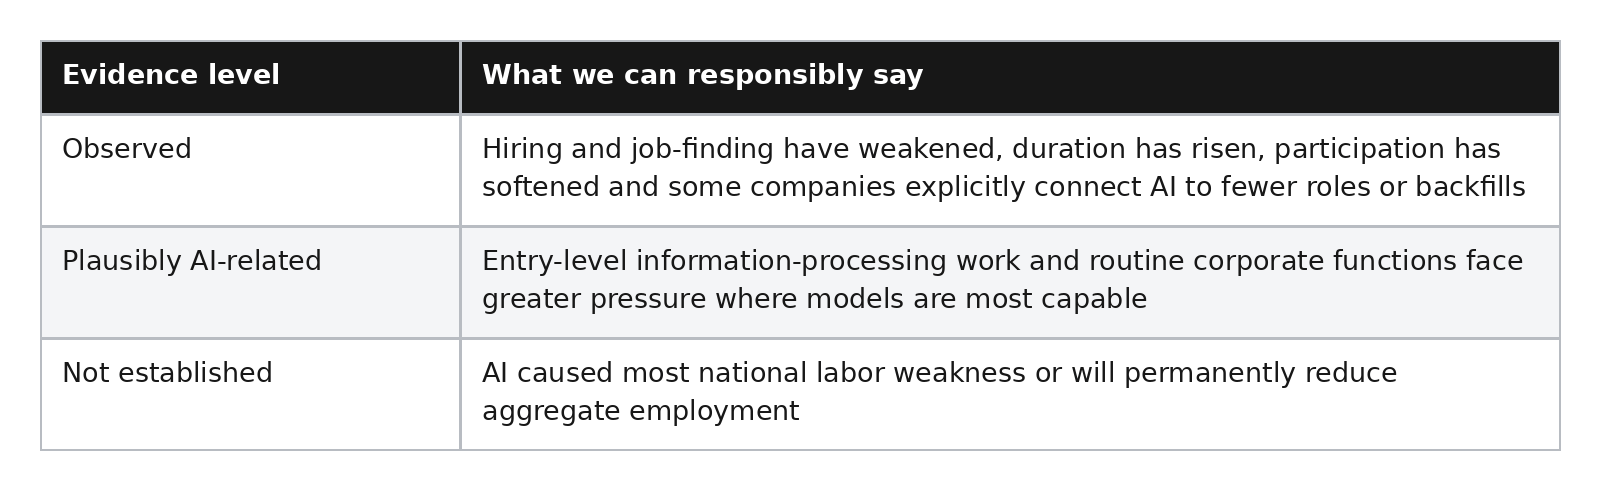
Interest rates, immigration, population aging, federal policy, post-pandemic overhiring and ordinary business cycles all affect the same indicators. AI exposure is correlated with industries that hired aggressively in 2020 through 2022, making causal attribution especially annoying. A technology company cutting staff in 2026 can be automating, correcting overhiring and pleasing investors at the same time.
The best national evidence currently supports a low-hire story more than a mass-fire story. The Federal Reserve Bank of Chicago estimated that nearly 80 percent of the increase in its flow-consistent unemployment rate from early 2023 through February 2026 came from reduced job finding, with about 20 percent from increased separation. That’s a model-based decomposition, not a count of jobs lost to AI. It supports the bathtub mechanism: the drain into employment slowed more than the layoff faucet opened.
As of May 2026, BLS estimated 7.6 million seasonally adjusted job openings, a 3.3 percent hiring rate, a 1.9 percent quits rate and a 1.1 percent layoff-and-discharge rate. The estimates were preliminary. Openings were far below their 2022 peak while layoffs remained historically restrained.
In June 2026, the household survey showed a 61.5 percent labor-force participation rate, a 59.0 percent employment-population ratio and a 4.2 percent unemployment rate. Long-term unemployment was approximately 1.9 million people, or 27.3 percent of all unemployed people, up 286,000 over twelve months. Those are observed BLS estimates; month-to-month household data are noisy and none carries an AI label.
Entry-level evidence is suggestive but mixed. Reuters reported that U.S. law firms with more than 500 lawyers hired 7.5 percent fewer new associates from the class of 2025, the first decline for that group since 2014, while the overall graduate employment rate remained 93 percent partly because the graduating class was smaller. Federal hiring and public-interest cuts contributed, and industry observers identified generative AI as a possible factor rather than a proven cause.
A LinkedIn and U.K. government brief found overall U.K. hiring down 14 percent year over year in April 2026, with entry-level accountant postings down 29 percent, graphic design down 28 percent and software engineering down 27 percent. Sales-development and business-development roles grew. The brief explicitly said the overlap with AI-capable information-processing work wasn’t causal proof. The geography differs from the U.S., but the occupational comparison is exactly the design future research should extend.
Company panels: expansion, compression and the messy middle
Corporate case studies should use the same columns so we can’t quietly switch metrics whenever the story changes.
Expansion, Compression and the Messy Middle
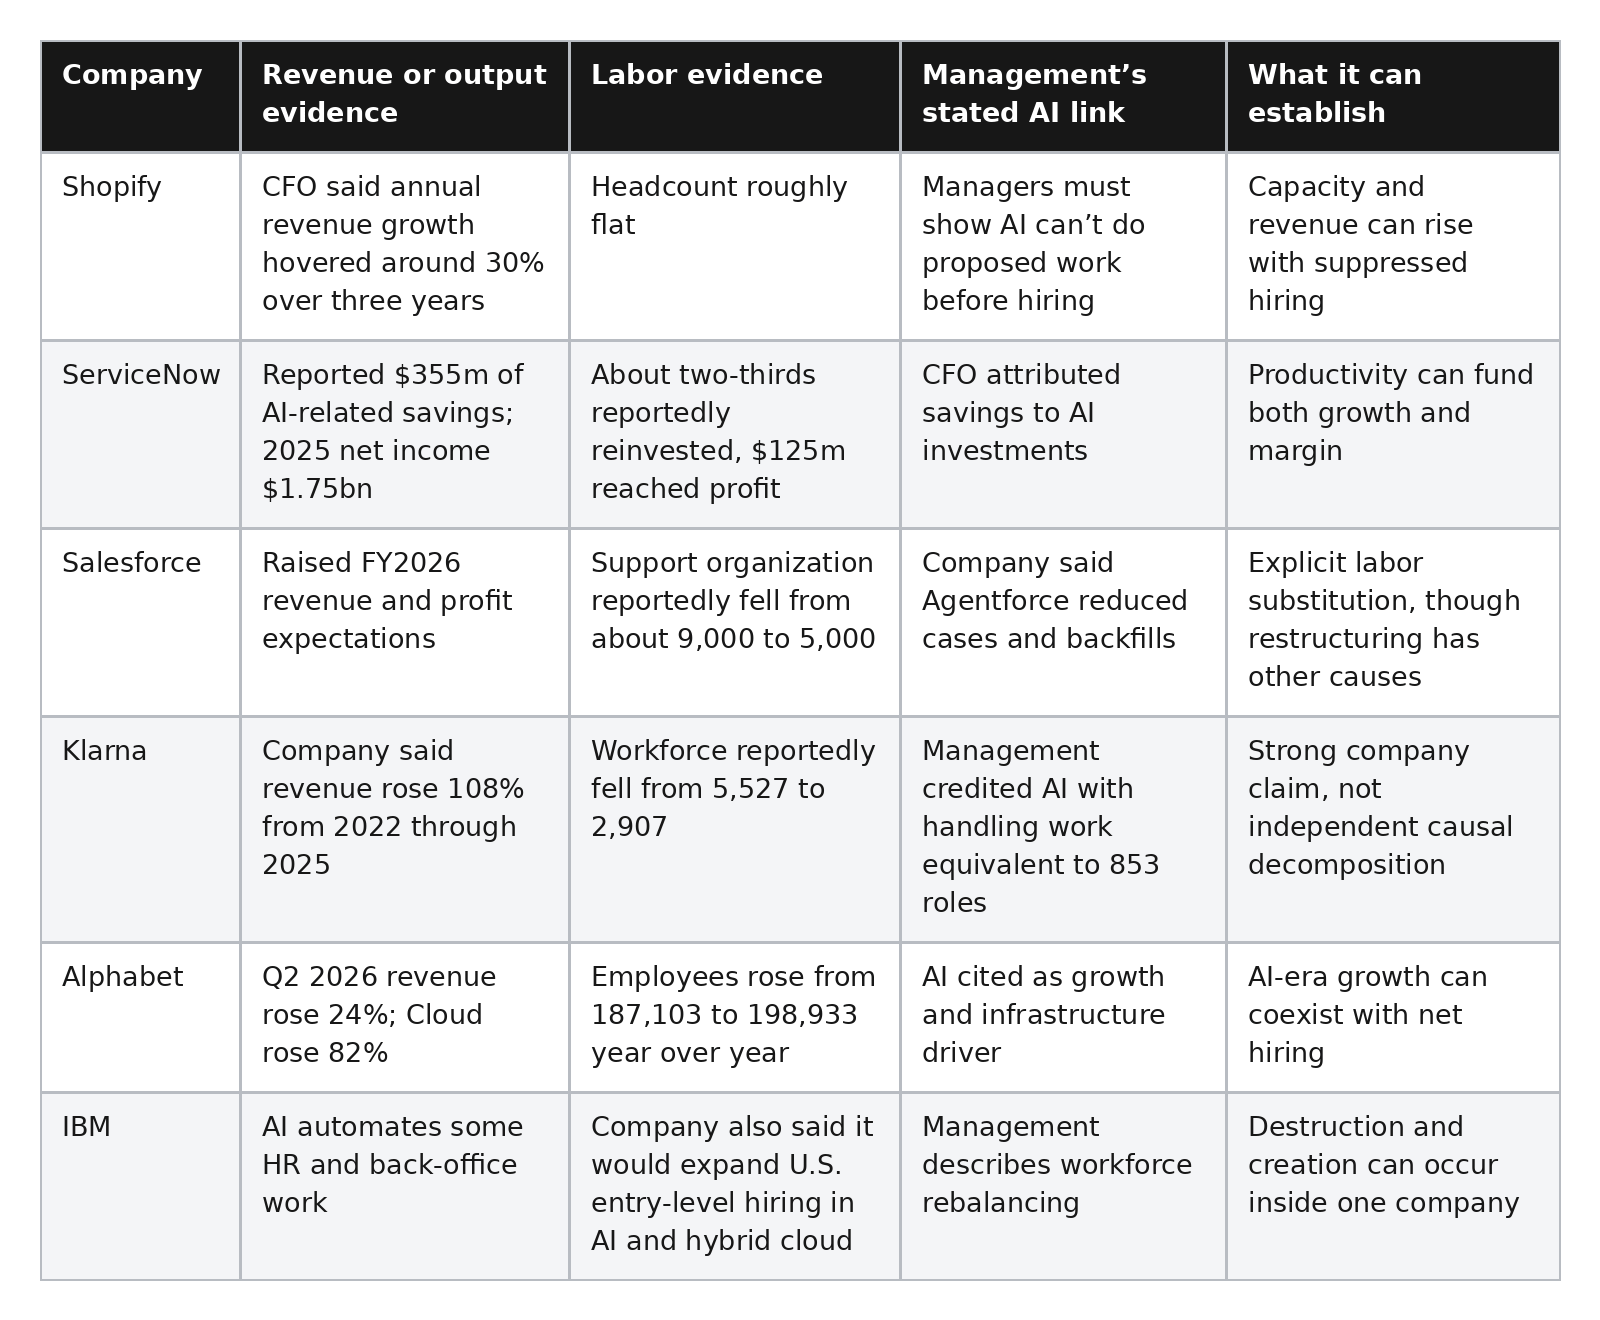
Shopify and ServiceNow figures were reported by the Wall Street Journal from CFO comments. Salesforce’s support reductions were reported by Reuters and company commentary. Klarna figures are company claims reported in 2025. Alphabet’s headcount and financial figures are company results. The table doesn’t establish a national causal effect. It shows the range of organizational responses the aggregate data must eventually reconcile. The company-level equation remains:

Shopify offers a plausible expansion case because revenue grew quickly enough to coexist with flat employment. Salesforce support offers compression because management says case volume and AI reduced the need to backfill. Alphabet demonstrates that an AI-intensive company can still add nearly 12,000 employees in a year. There isn’t one universal path here. The narrower claim is that when customer revenue doesn’t absorb the capacity, labor is the lever management controls.
The dashboard that would change our minds
The Labor Dashboard That Would Change the Argument
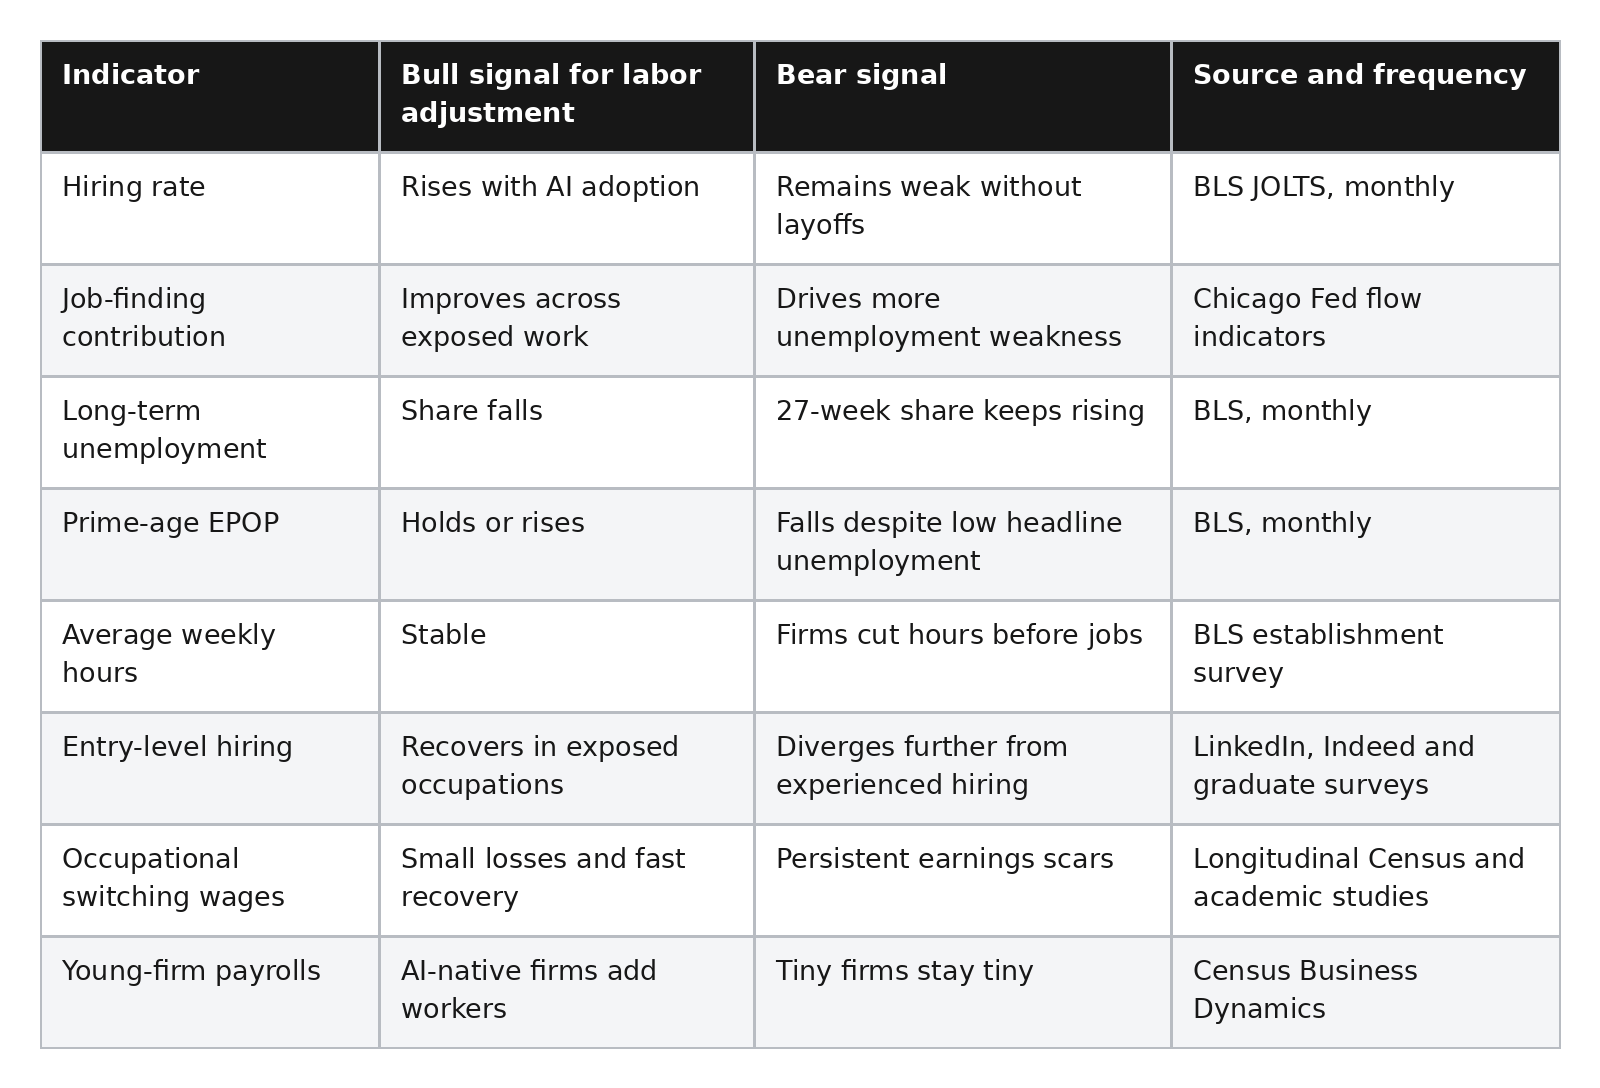
If hiring, job finding, entry-level placement and young-firm payrolls recover while AI adoption deepens, immediate displacement is being absorbed quickly and the bearish labor case weakens. If layoffs stay low but those entry channels deteriorate, “employment is still positive” won’t be a sufficient rebuttal.
A low-hire labor market can hide the transition
The unemployment rate is useful, but it is a snapshot of one compartment. It counts people without work who are available and have recently searched. It does not directly count canceled job openings, graduates who never enter an exposed occupation, contractors who lose hours, workers who accept lower-paying jobs, or employees who keep a badge while their promotion ladder disappears. A company can reduce its intended headcount from 500 to 404 without announcing 96 layoffs. It can hire fewer people for three years and arrive at nearly the same destination with much less television footage.
The better mental model is a bathtub. Employment fills when unemployed people find jobs, new entrants are hired and people return from outside the labor force. It drains through layoffs, quits into nonemployment, retirement and disability. A low-hire, low-fire market partially closes both faucets. Incumbents look protected because layoffs remain modest, while new entrants and displaced workers spend longer outside the tub because job finding slows.
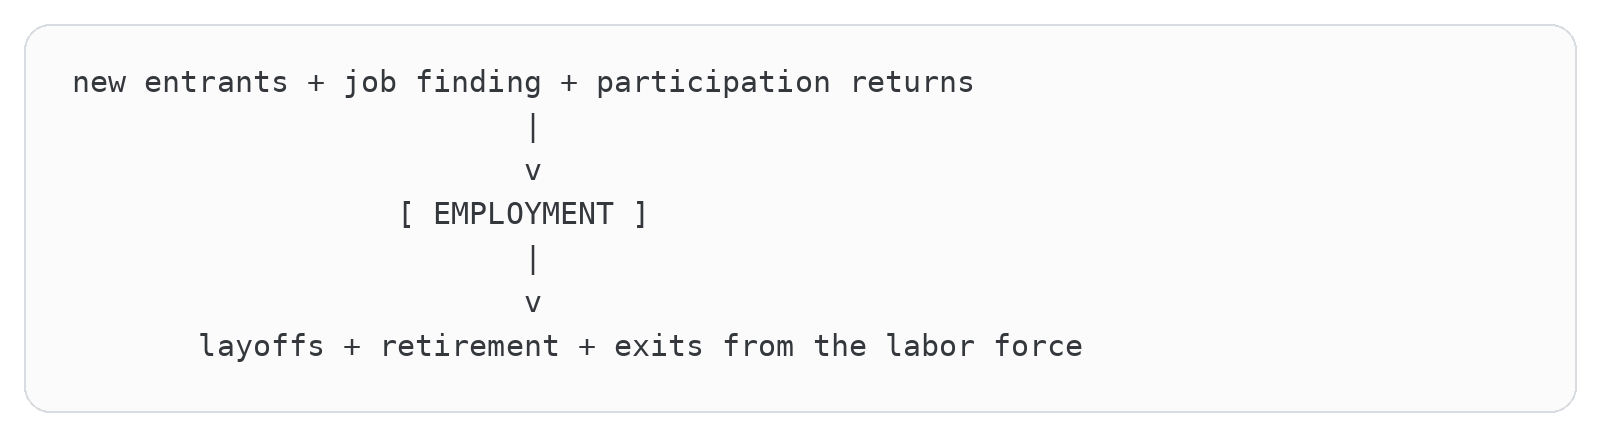
That is why we need a compact dashboard rather than one magic statistic. Hiring and job-finding rates show whether the market absorbs people. Job openings show employer intent, imperfectly. Average hours can weaken before payrolls do. Long-term unemployment shows whether joblessness is becoming sticky. Prime-age participation and the employment-population ratio catch some people who move outside the official unemployment boundary. Entry-level hiring reveals whether a career ladder is narrowing before the incumbent workforce shrinks. None of these series carries an “AI did this” label, and interest rates, post-pandemic normalization, federal policy, demographics and industry cycles all matter. The responsible claim is narrower: the early AI period is arriving inside a low-hire environment where displacement can appear as failed entry and slow reemployment before it appears as mass layoffs.
Long-term unemployment is especially important because a six-month spell is not merely six times a one-month spell. Skills decay, networks weaken, savings disappear and employers can interpret the duration itself as a negative signal. In June 2026, people unemployed for at least 27 weeks represented 25 percent of all unemployed people, up from 21.2 percent a year earlier. That does not prove AI causality. It does tell us the economy was taking longer to reabsorb a meaningful share of displaced workers precisely when companies were beginning to redesign knowledge workflows around models.
The survey distinction matters too. Payroll data count jobs at establishments. Household data classify people as employed, unemployed or outside the labor force. A person can lose a full-time job, do a few hours of contract work and remain employed in the household survey while experiencing an enormous income shock. Another can stop searching and disappear from unemployment entirely. This is why a low headline unemployment rate does not refute hiring suppression, and why a weak participation number does not automatically prove hidden AI unemployment. The measurements illuminate different doors into the same room.
For Atlas, the important variable is not whether every exposed worker becomes officially unemployed. It is how much enterprise labor spending would have occurred without AI. The counterfactual includes hires never made, roles not backfilled, contractor budgets reduced and wage growth that never arrives. Those savings can support enterprise AI spending even while published layoff counts remain small. On Atlas’s income statement, a payment funded by a missing hire looks identical to a payment funded by a successful new product. On the broader economy’s income statement, they are very different events.
We still do not know the replacement organization
The bull case begins where the simple headcount calculation ends. Extra productive capacity can create new products, cheaper services and companies that were previously impossible. The likely organizations range from familiar copilots, where one worker does the same job faster, to centaur teams that divide judgment between people and models, to agent supervisors who handle exceptions, to tiny AI-native companies that serve markets too small for conventional software economics. Domain experts may build tools through natural language without becoming traditional software engineers. Human-premium services may grow precisely because automated output becomes abundant.
Those are plausible forms, not established employment categories at scale. We do not yet know their number, wage distribution, geography, training requirements or arrival time. A manager can cancel ten requisitions this afternoon. A new profession needs customers, norms, legal boundaries, education and a company willing to hire its first beginner. Destruction can move at software speed while absorption moves at the speed of institutions.
This uncertainty cuts both ways. Bears cannot assume new work fails to appear. Bulls cannot cite a handful of “AI agent manager” job postings as proof that the new labor market already exists. The useful evidence will be business formation, payroll growth at young firms, occupational switching, wage recovery and whether entry-level ladders reappear in exposed fields. Until then, the immediate corporate incentive is observable while the replacement structure remains a forecast.
History says the economy adjusts, but the original workers often don’t
The optimistic history of technology says cars eliminated horse jobs but created automobile jobs, tractors eliminated farm work but created factory work, and computers eliminated typists but created software engineers. That conclusion is broadly right and almost useless unless we inspect the transition. Adjustment usually occurred through some mixture of new demand, migration, investment, retraining, retirement and younger workers choosing different careers. It often produced a richer society without making the displaced incumbents whole. Each example below isolates one mechanism that would have to create Atlas’s future customers.
Teamsters saw the truck coming
The transition from horse transport to motor vehicles is useful because displacement began before trucks completely dominated the road. Workers didn’t need a modern labor economist to explain what an engine would eventually do to a horse-drawn freight business. They could hear the engine.
The 1910 Census counted 421,983 teamsters driving horse-drawn vehicles. That fell to 350,657 in 1920 and 177,815 by 1930. In two decades, the occupation declined by roughly 58%.
The most interesting change happened before the steepest employment decline. During the 1910s, entry by workers around age 30 fell by approximately one-third compared with the previous decade. The occupation aged as younger workers avoided a career with a visible expiration date. Some older workers still entered because they expected to retire before motor vehicles completed the transition, and wages temporarily rose enough to compensate people for accepting the risk.
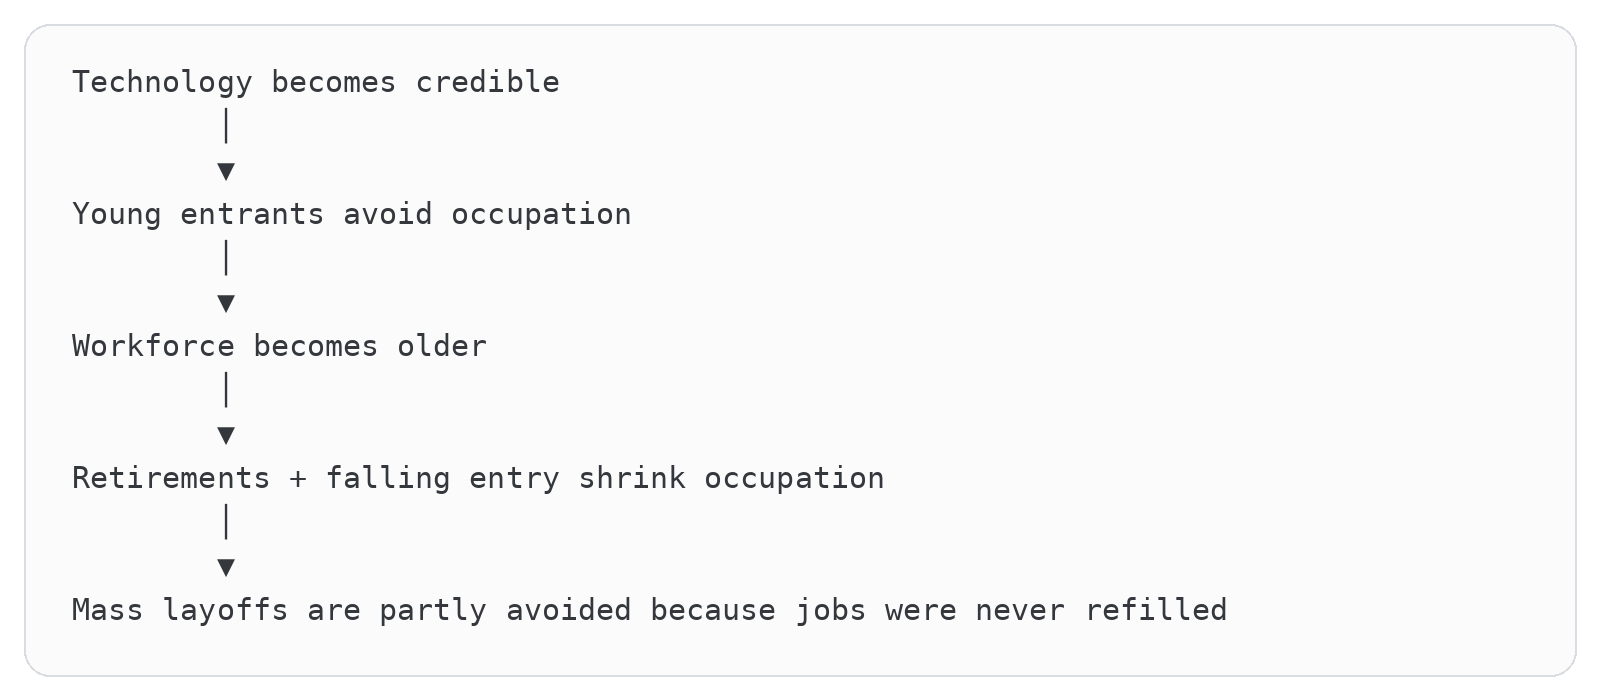
This is exactly why focusing only on layoffs can miss an AI employment transition. An occupation can contract through career avoidance and attrition long before an executive announces that a model replaced anyone.
The automobile economy eventually created assembly work, repair shops, trucking, road construction, petroleum refining, dealerships, insurance, motels, suburbs and modern logistics. Those complementary industries became far larger than the stable and carriage economy they replaced, but they didn’t appear at the same moment, in the same town or with the same skill requirements. A stable worker couldn’t submit a Jira ticket requesting conversion into a petroleum engineer.
The transition required new physical capital, migration, technical education and decades of demand growth. Society became wealthier because transportation became vastly more useful, not because every worker kept doing a slightly upgraded version of the old job.
Telephone automation saved future cohorts, not incumbent operators
Mechanical switching offers a cleaner comparison for cognitive automation. Telephone operators performed information-routing work through a human interface. The customer requested a connection, and a trained worker manipulated the system behind the scenes. That’s uncomfortably close to many modern administrative workflows.
Researchers James Feigenbaum and Daniel Gross studied differences in when local telephone systems became automated. Mechanization sharply reduced operator employment. Future cohorts of young women were largely absorbed into other clerical and service occupations, meaning overall employment for new entrants didn’t collapse. Existing operators experienced a different outcome. Years later, they were more likely to have moved into lower-paid work or left employment. The adjustment mechanism wasn’t magical retraining:
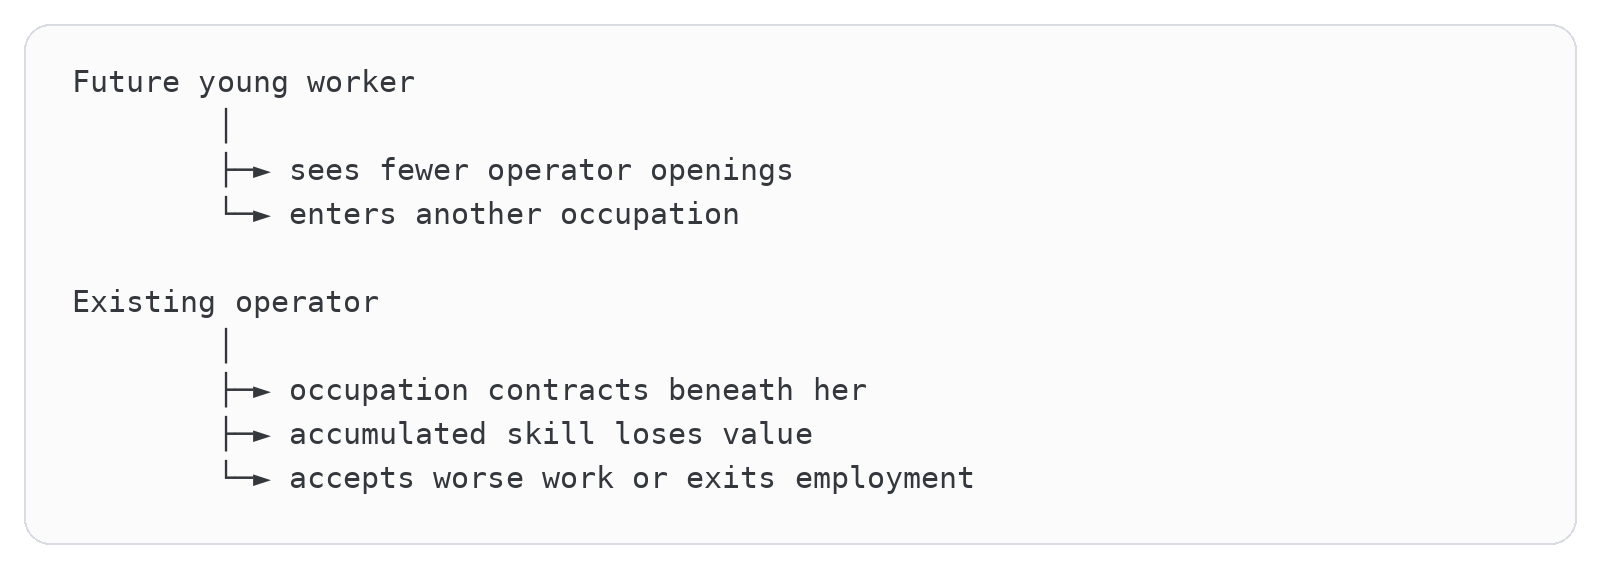
Aggregate employment can therefore recover while the people directly exposed to automation suffer persistent losses. “The next generation found different jobs” and “incumbent workers were made whole” are completely different claims.
This may be the closest historical template for junior knowledge work. Companies can retain experienced engineers, accountants and analysts while creating fewer entry-level openings beneath them. Ten years later, young workers may enter different occupations and overall employment may look fine. The original career ladder can still be permanently smaller.
Agriculture proves that output and employment can move opposite ways for seventy years
Agriculture is the cleanest answer to the claim that rising output necessarily protects sector employment. Between 1948 and 2017, American farm output nearly tripled while farm employment fell 81% and labor hours declined 83%. Agriculture’s share of US employment dropped from 13% to 2%, while nonagricultural employment roughly tripled.
The farm sector produced far more with far fewer hours:

This happened because machinery, chemicals, improved seeds, farm organization and purchased services substituted for labor. Hired labor hours fell from 5.9 billion to 1.6 billion, while self-employed and unpaid family labor fell from 13.5 billion hours to about 1.7 billion.
Demand couldn’t expand enough to preserve farm employment because food consumption has limits. Lower wheat prices don’t cause a family to eat fourteen dinners. Productivity therefore released labor into the rest of the economy.
The “solution” was not more agricultural employment. It was a different economy.
Workers migrated geographically and occupationally. Manufacturing, construction, transportation, healthcare, education and professional services grew. Educational attainment increased. Children entered jobs their parents hadn’t performed. The transition unfolded over several generations and was supported by enormous investments in cities, roads, housing, schools and industrial capacity.
AI optimists may ultimately be right that the same thing happens again. But they have to identify the expanding destination. Saying “farmworkers found other work” is not evidence that displaced accountants will become AI safety engineers. It’s evidence that sectoral displacement can be compatible with long-run prosperity when other sectors expand enough to absorb the labor.
Computers created millions of jobs while deleting specific occupations slowly
The personal-computer transition shows how long employment effects can lag the original invention. Between 1999 and 2018, total employment across consistently tracked occupations rose by 19.5 million, or 17%. At the same time, occupations losing more than 45% of their employment fell from approximately 7.03 million jobs to 2.65 million, a reduction of 4.38 million. The casualties included:
Computers Did Not Treat Every Clerical Occupation Kindly
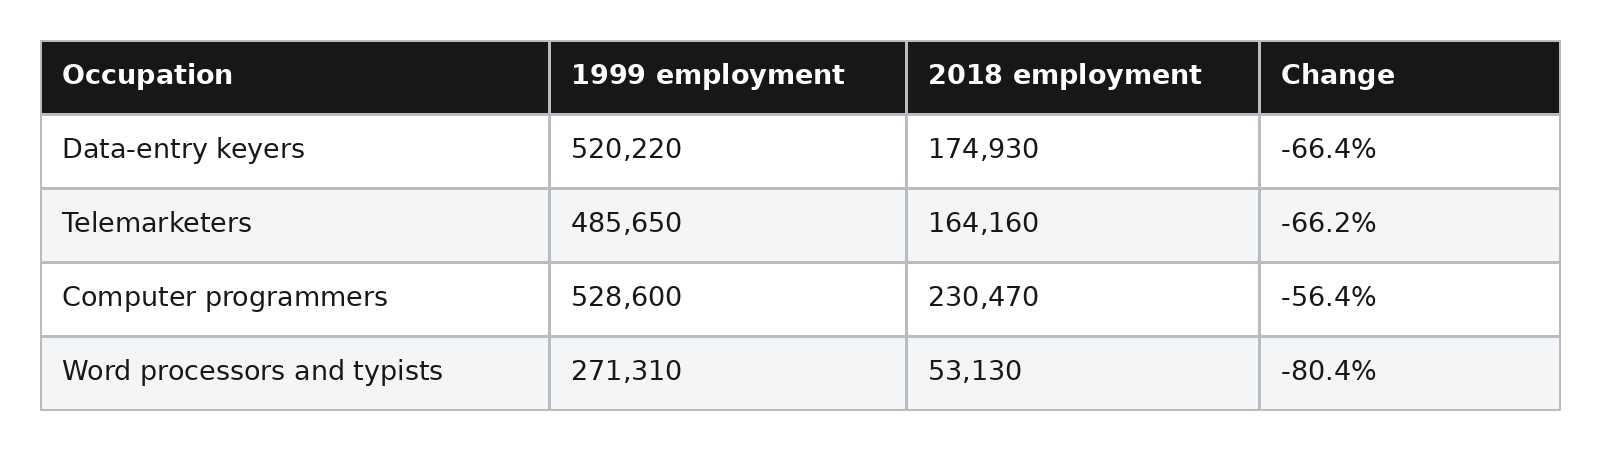
The economy added far more jobs elsewhere than these occupations lost. That is the optimistic result. The less comforting result is that the declining occupations really did decline. A rising national employment total didn’t cause word-processing jobs to reappear.
The BLS noted that many contractions reflected technologies introduced years or decades earlier. The microcomputer revolution began transforming offices in the 1980s, but clerical displacement remained visible from 1999 through 2018. Commercial adoption and full occupational impact operate on different timelines. This gives us another lag structure:

The absence of immediate mass unemployment tells us almost nothing about the eventual size of an occupational transition.
The ATM story was a demand-elasticity story
ATMs are constantly used as a magic phrase that ends automation debates. Banks installed hundreds of thousands of machines, yet teller employment initially held up. Therefore, apparently, machines never replace anyone and we can all go home.
The actual mechanism was market expansion. ATMs reduced the number of tellers required per branch, helping make branches cheaper to operate. Banks responded by opening many more locations. From 1980 to 2007, the number of ATMs rose from about 19,000 to 415,000 while branches increased from roughly 39,000 to 79,000. Tellers per branch reportedly fell from about 20 in 1988 to 13 in 2004, but the expanding branch count offset much of that reduction.

Once online and mobile banking weakened the case for physical branch expansion, the offset faded and teller employment declined. The ATM lesson isn’t that automation preserves jobs. It’s that automation can preserve jobs when it lowers costs enough to create sufficient new demand for the surrounding service.
The AI equivalent requires an answer to a very specific question: what is the doubling of bank branches?
If coding agents make each engineer 50% more productive, do companies commission 50% more valuable software? If support agents double worker capacity, do companies attract twice as many paying customers? If AI accelerates internal reporting, does anyone want twice as many reports?
Without a market-expansion mechanism, the teller-per-branch effect eventually wins.
AI may destroy at software speed and create at institutional speed
Past transitions were constrained by the physical world. Replacing horses required manufacturing vehicles, building roads, producing fuel and creating repair networks. Telephone automation required physically replacing switching equipment city by city. Farm mechanization required farmers to purchase machinery and reorganize production.
AI can diffuse through software. A company can deploy an agent to thousands of employees without rebuilding its offices. That creates three different clocks:
AI Can Remove Work Faster Than Institutions Create Replacements
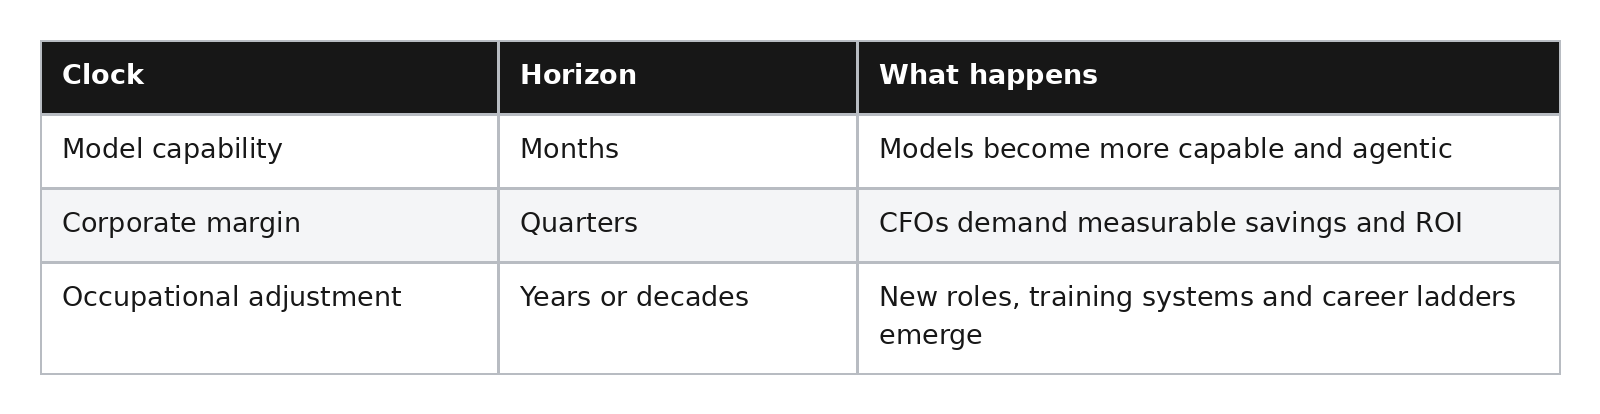
The labor-saving capability can arrive in months. The occupations and institutions required to absorb displaced workers may take years.
AI also affects parts of the sectors that historically absorbed displaced labor. Farmworkers moved into factories. Factory workers moved into services and offices. AI is entering software, finance, administration, design, customer support, marketing, research and professional services at roughly the same time.
Healthcare, construction, energy, advanced manufacturing, education and AI-native entrepreneurship may eventually absorb substantial labor. But “eventually” is doing an enormous amount of work in that sentence.
The defensible claim isn’t that labor will decline forever.
It’s that immediate displacement looks increasingly likely because companies can capture labor savings before new AI-native occupations, products and markets become large enough to absorb the released workers.
The macro loop can run clockwise or backward
So far we’ve viewed labor from one company’s conference room. The CFO replaces payroll with AI expense, margins rise and shareholders celebrate. Zoom out to the entire economy and payroll is also household income. One company’s cost is another person’s purchasing power.

Now let automation remove $100 billion of payroll. The company-level effect is positive if AI costs less than the labor it replaces. The macro effect depends on where the $100 billion goes and how quickly it gets spent. If it becomes lower prices, consumers’ real purchasing power rises. If it becomes investment in new factories and firms, labor demand can return. If it becomes profit distributed to owners who spend a smaller share of each extra dollar, aggregate consumption can weaken.
Economists describe this with the marginal propensity to consume. Let (m_w) be the share of an additional labor-income dollar spent and (m_c) the share of an additional capital-income dollar spent. If (m_w=0.9) and (m_c=0.5), shifting $100 billion from wages to capital reduces first-round consumption by roughly:

That’s an illustrative sensitivity, not an empirical estimate for current AI displacement. Taxes, borrowing, wealth effects, imports and monetary policy change the multiplier. The mental model shows why distribution affects demand even when national income initially looks unchanged. There are at least six escape valves.
First, lower prices can increase real demand. If AI cuts the price of legal work 80 percent, millions of people previously priced out may buy it. Second, profits can finance productive investment. Data centers, energy, robotics and startups hire people. Third, shareholders can spend rising wealth, though ownership concentration affects how broad that channel is. Fourth, new firms can enter because minimum efficient scale falls. Fifth, fiscal policy can recycle gains through tax credits, transfers, public investment or wage subsidies. Sixth, society can convert productivity into shorter workweeks rather than fewer workers, preserving employment while raising leisure. The healthy adjustment looks like this:
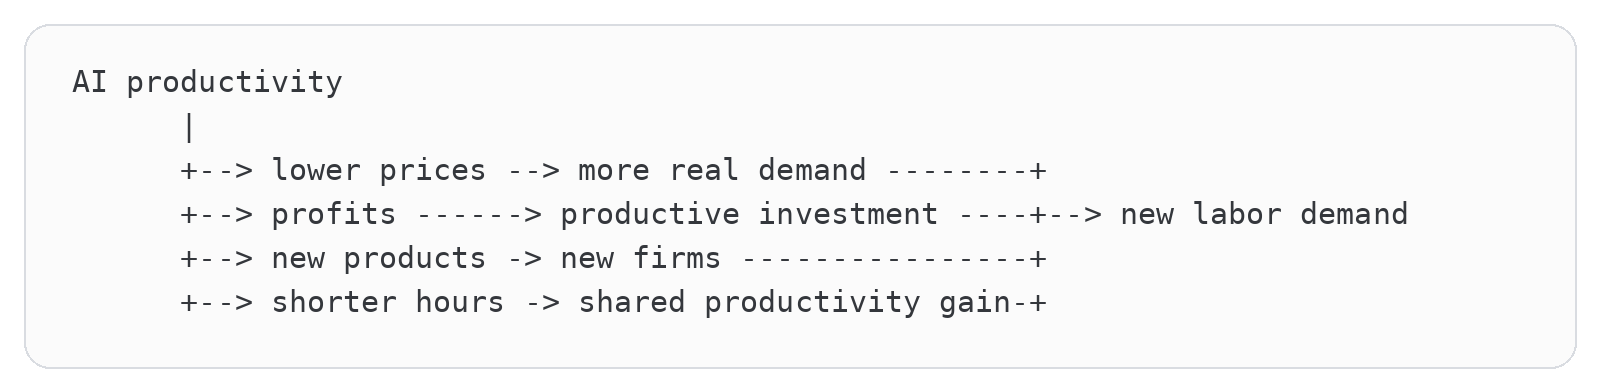
The unhealthy loop runs backward:

Anthropic and OpenAI sit inside this contradiction. Their enterprise value proposition can be funded from labor savings today. But if labor-budget capture becomes broad enough and replacement demand arrives slowly, their customers eventually face weaker end demand. The labs don’t need mass unemployment for this to matter. Slower wage growth, fewer hours, reduced hiring and more income concentration can all soften consumption at the margin.
The strongest bull response is productivity history. Economies aren’t fixed circular-flow diagrams. Lower cost creates goods that didn’t exist, real income rises and investment expands productive capacity. Correct. The question is the transition speed and distribution. Company budgets reset annually. New industries, housing, credentials, laws and worker mobility take longer. Evidence that the healthy loop is winning would include broad real-wage growth, rising labor-force participation, accelerating new-firm payrolls, declining prices in AI-exposed services, strong consumption across the income distribution and labor’s share of value added stabilizing. Evidence for the adverse loop would be productivity and profits rising alongside weak hiring, falling hours, persistent long-term unemployment and consumption increasingly dependent on high-income households.
This is also where policy starts to matter, and we don’t need to turn this into a manifesto to see why. Faster permitting and abundant energy can lower infrastructure cost. Portable benefits, wage insurance and training tied to actual employer demand can reduce transition losses. Competition policy can prevent the gains from pooling entirely at a few chokepoints. Tax and transfer systems can support demand. Shorter standard workweeks can distribute hours. None guarantees success, and badly designed intervention can freeze obsolete structures. Capitalism’s adjustment mechanism is powerful. It works better when displaced people can afford to remain customers while the next market forms.
Chapter 17: When Company Savings Become an Economic Problem
Return to the 500-person enterprise. Suppose additional demand and new projects absorb 35 positions’ worth of capacity, reassignment absorbs 10, contractor reductions absorb 12, attrition and non-backfilling absorb 25 and layoffs absorb the final 14. The exact partition is hypothetical. Its purpose is to show why no single labor statistic captures the economic adjustment.
Where the Enterprise’s 96 Positions of Excess Capacity Go
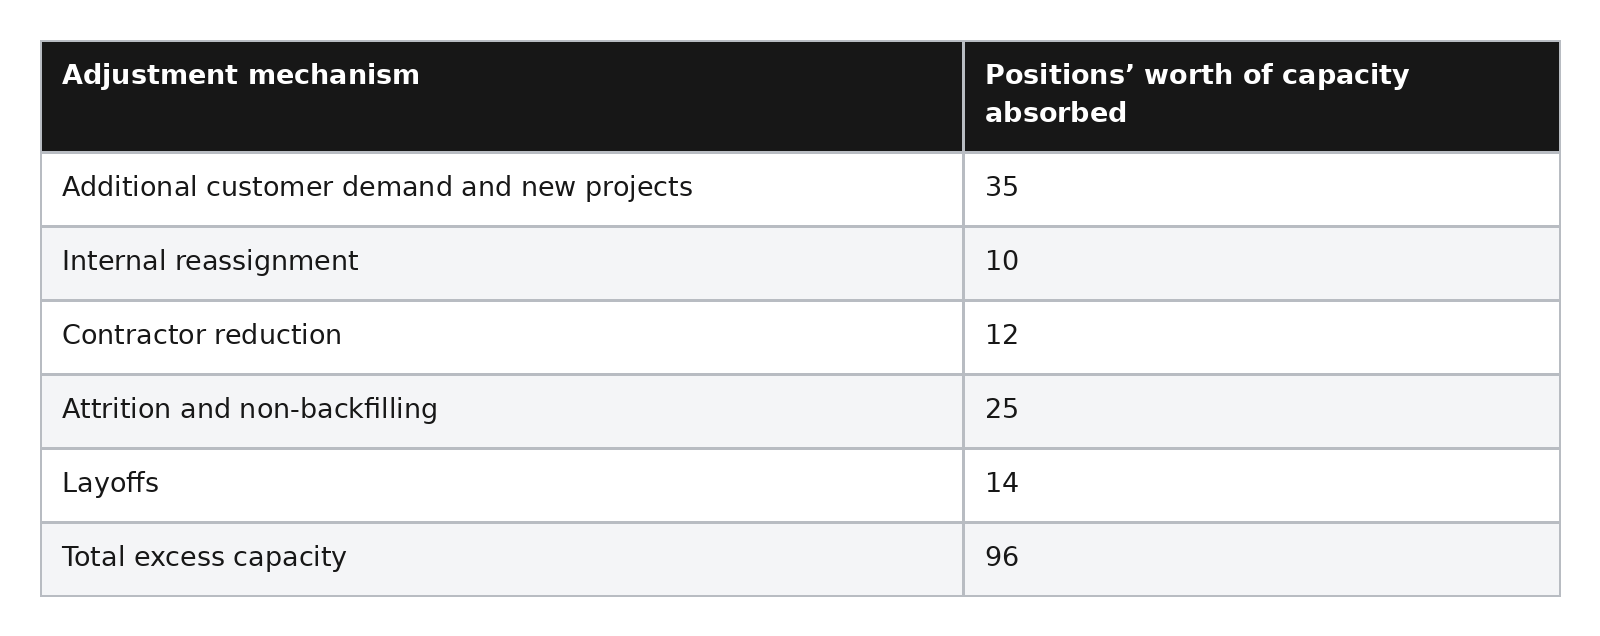
From the CFO’s perspective, the combination can validate the $20 million AI budget without a dramatic layoff announcement. From Atlas’s perspective, the source of payment is real. From the economy’s perspective, the composition matters. New demand and new projects expand output and income. Contractor reductions, missing hires and layoffs reduce labor-income growth unless another firm or industry absorbs the people. One company sees:

The economy can see:

That loop is not destiny. Lower prices raise real purchasing power. Investment creates jobs. New companies form. Fiscal transfers, broader capital ownership and shorter workweeks can distribute productivity gains. The bull case wins if those positive channels expand fast enough that enterprise revenue grows alongside AI capacity. The bear case wins if labor compression arrives first and the replacement demand arrives after Atlas’s financing clock has already started ticking.
This is the point where the customer’s customer enters the Atlas model. In the early phase, the enterprise can fund AI from an existing technology budget, investor capital or a slice of newly identified labor savings. In the middle phase, non-backfilling and contractor reductions can make the economics look better even if sales barely move. But once the organization reaches its practical labor-saving ceiling, continued spending growth requires net market expansion.
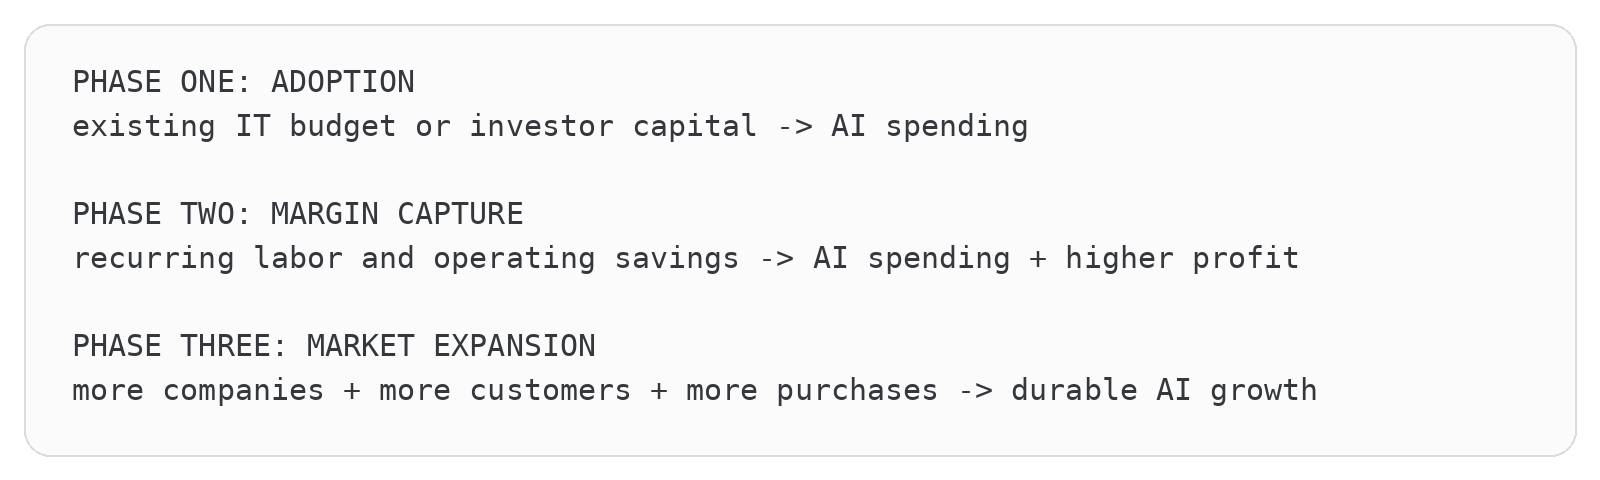
The first phase proves that companies want the technology. The second proves that AI can redistribute margin. The third proves that the economic factory can expand instead of merely reallocating the same revenue through fewer workers and more machines. Atlas has been financed as though all three phases are one smooth curve. They aren’t.
The crucial market-level equation is therefore not just whether one company earns a return. It is whether net customer revenue eventually grows fast enough to carry the claims stacked above it:

As the remaining savings pool shrinks, the first term has to do more work. That revenue can come from incumbents selling more to existing customers, incumbents reaching customers who were previously priced out, or entirely new companies and markets appearing because AI lowers the minimum cost of building them. This does not mean labor must decline forever. It means the opposite. The cleanest path out of the transition is for revenue expansion to arrive quickly enough that companies need the released capacity again, whether inside the incumbent or inside a new firm.
Part V: Two Futures for the Same Factory
Chapter 18: The Complete Bear Case
We have spent thousands of words examining pieces of the bearish argument, which creates a slightly ridiculous problem: the bear case is everywhere and therefore harder to see. So let’s stop moving, put Atlas in the middle of the page and state the wager in one chain.
The bear case is not that AI demand disappears. It is not that models stop improving, enterprises abandon agents or Atlas goes dark. The concrete bear case is that AI capability and productive capacity grow faster than the final customer revenue required to support every financial claim built around them.
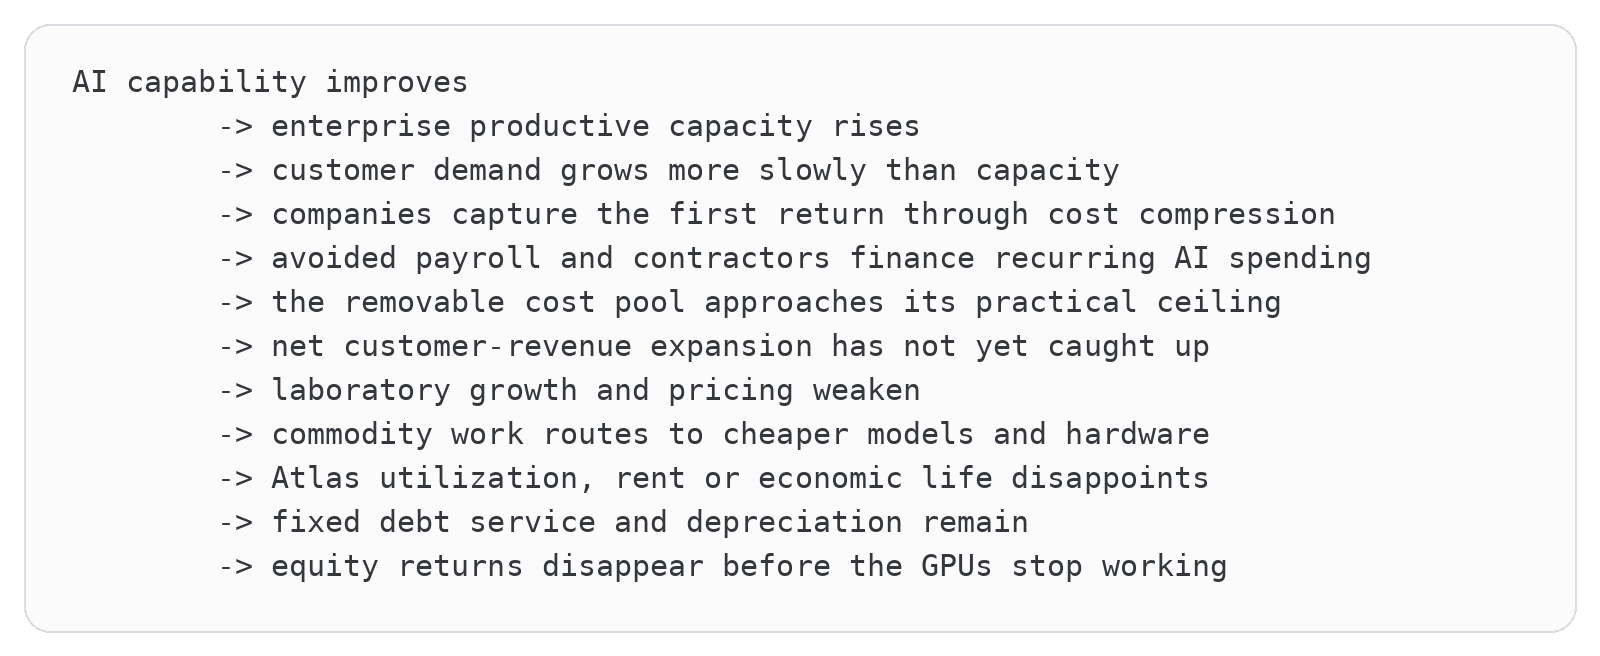
There are five claims packed into that diagram. First, AI can create more output capacity than the market immediately wants to buy. A coding team may produce more software, a support department may resolve more tickets and a marketing group may manufacture enough personalized copy to make the internet beg for mercy. None of that automatically creates a paying customer. Capacity is an option to serve demand, not evidence that demand exists.
Second, companies can bridge the gap through cost removal. The enterprise customer doesn’t need 30 percent more sales to justify its first AI deployment if it can avoid hiring, reduce contractors or consolidate a function. That is real value. It also gives laboratories genuine revenue and Atlas genuine cash flow. The bear doesn’t need to pretend any invoice is fake.
Third, the bridge has a finite length. An avoided salary recurs, but the same hire can’t be avoided twice. Contractor spending can fall to zero. A department can be compressed only until service, judgment, accountability and the remaining workload require the people who are left. As the available savings pool flattens, continued growth in the AI bill must increasingly be financed by gross profit from additional sales.
Fourth, the price of intelligence can fall before the cost structure built to manufacture it has fully matured. Distillation, routing, open models, custom silicon and competition can make AI dramatically cheaper for customers while frontier laboratories still carry training expense, contractual cloud commitments and the costliest requests. Total AI usage can explode while premium frontier volume, realized task pricing or gross margin disappoints.
Fifth, Atlas was financed against a smoother curve than the economy is obligated to provide. Its debt service does not become philosophical when utilization misses. Its equipment does not stop depreciating while society invents a new occupation. A moderate shortfall in billable hours, realized price or hardware life can destroy the equity return even when the facility remains technically useful.
The market-level equation is brutally small compared with the factory:

Early in adoption, both terms can contribute. As the remaining savings pool approaches its ceiling, the second term has to carry more of the stack:

If claims on future AI revenue continue compounding faster than the customer revenue AI actually helps create, the technology can win while the investment arithmetic loses:

Now run those abstractions through the people we have already met. The enterprise renews its AI contract because fewer hires and contractors offset the bill. The laboratory books growing revenue and reserves more cloud capacity. Atlas reports higher utilization and services its debt. The chip and memory suppliers expand production. The utility builds generation. For several years, every layer can report something encouraging. Then the enterprise reaches the point where further cost removal threatens the business and its AI-attributable sales still aren’t large enough to fund another 25 percent increase in spending. Growth slows at the top of the payment chain. The laboratory routes ordinary tasks downward, negotiates harder on capacity and protects cash. Atlas loses price or volume. Nothing explodes. The financing simply discovers that the customer’s savings curve was a plateau rather than a staircase.
This bear case is falsifiable. It weakens if AI-intensive enterprises report attributable gross-profit expansion that consistently outruns their AI bills, while unit sales and customer counts grow with productive capacity. Young AI-native firms should add meaningful payroll, entry-level hiring should recover and laboratory gross margins and free cash flow should improve despite falling task prices. Old accelerator clusters should retain high utilization at economically attractive rates. In that world, the bridge reached a new market before Atlas’s financing clock ran out.
Chapter 19: The Complete Bull Case
Induced demand could outrun every efficiency gain
Before we declare Atlas stranded and congratulate ourselves for being clever, let’s give the bulls their best shot. The lab says demand is compounding. The hyperscaler says the site can host many workloads. Better software will raise throughput. The lender points to the reusable shell and tenant guarantees. The CFO says lower prices will create products customers couldn’t previously afford. Every one of those arguments could be right.
The real bull case isn’t “AI is cool” or “have you seen my chatbot write a poem?” It has to carry a dollar all the way from cheaper intelligence to somebody else’s bank account. The complete chain looks like this:
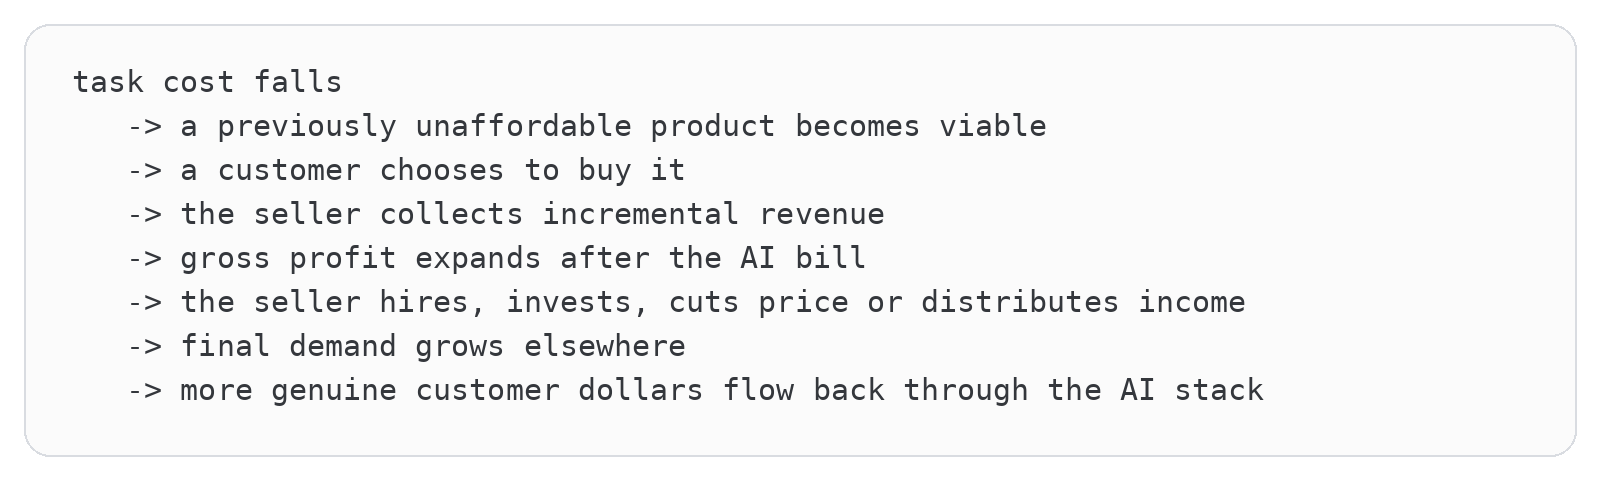
Every arrow matters. Cheap intelligence without a product is a technical achievement. A product without a paying customer is usage. Revenue without gross profit can still destroy capital. Profit that never returns through investment, wages, lower prices or spending can concentrate gains without generating enough broad demand to support the next round. The strongest bull case says the whole chain will work, repeatedly and at a scale that outruns falling unit prices and the finite pool of costs available to remove. It starts with induced demand.
When the cost of computation fell, society didn’t purchase a fixed number of calculations and fire the excess mathematicians. Cheap compute created spreadsheets, video games, smartphones, search engines, cloud software, digital advertising and industries that couldn’t have existed at the previous price. The amount of computation consumed exploded faster than the cost per calculation fell. AI could follow the same curve:
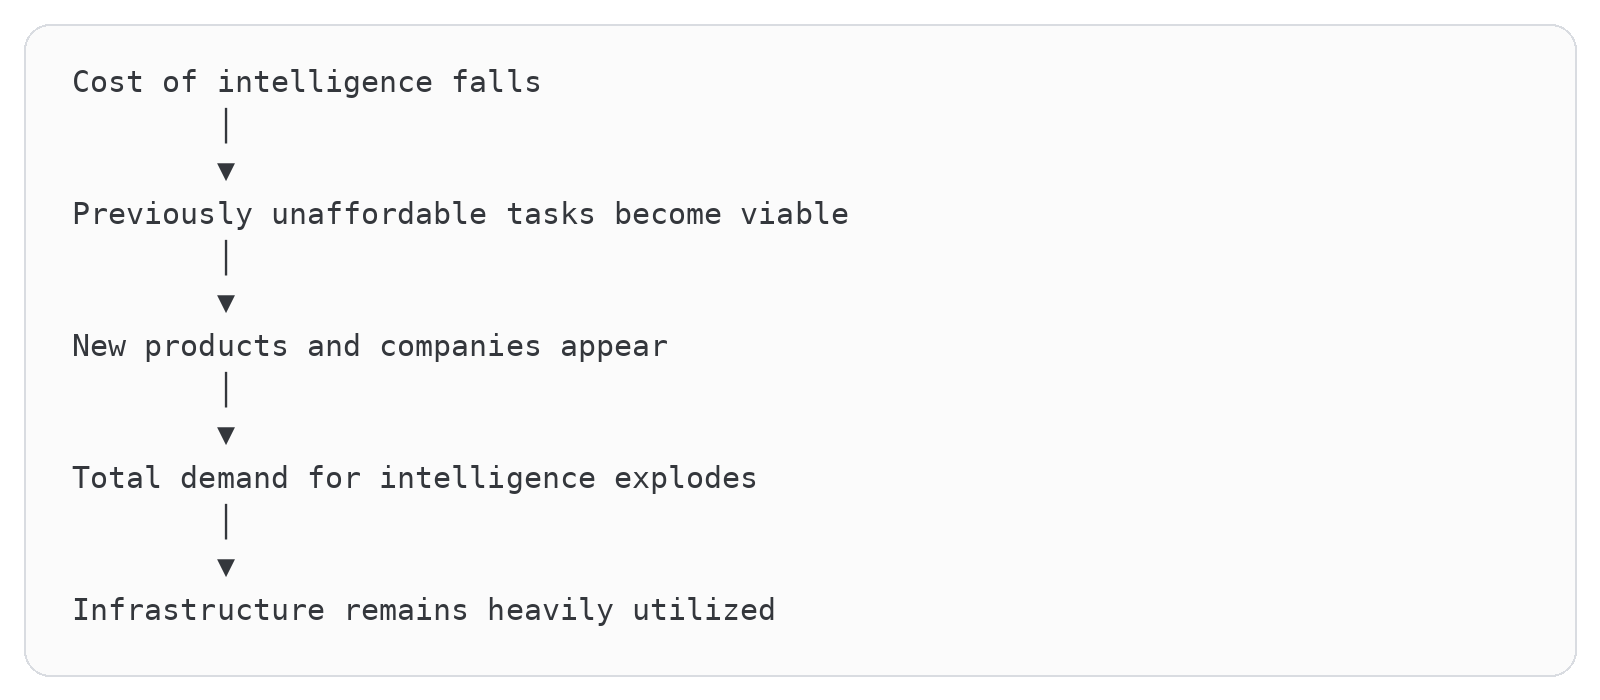
If every small business can afford custom software, every student receives a tutor, every patient receives administrative assistance and every scientist operates a team of research agents, total inference demand could grow by orders of magnitude. Falling price per token wouldn’t reduce spending because the world would consume vastly more tokens. Mathematically, total model revenue is:

If price falls 90% while consumption rises one hundred times, revenue rises tenfold:

The bulls can also point out that current capital intensity may be front-loaded. Railroads, power grids and cloud platforms required enormous early investment before demand matured. Once the network existed, utilization and operating leverage improved. Frontier labs may be building ahead of a demand curve that hasn’t remotely reached its useful ceiling.
They can argue that inference optimization is compounding across hardware, software and architecture. Quantization reduces bytes moved. Better batching increases reuse. speculative decoding generates more accepted tokens per expensive model step. Faster HBM feeds arithmetic units. Distillation moves routine work to efficient students. Caching prevents repeated prompt processing. Custom accelerators remove unnecessary generality. Any single improvement looks insufficient, but the stack can multiply.
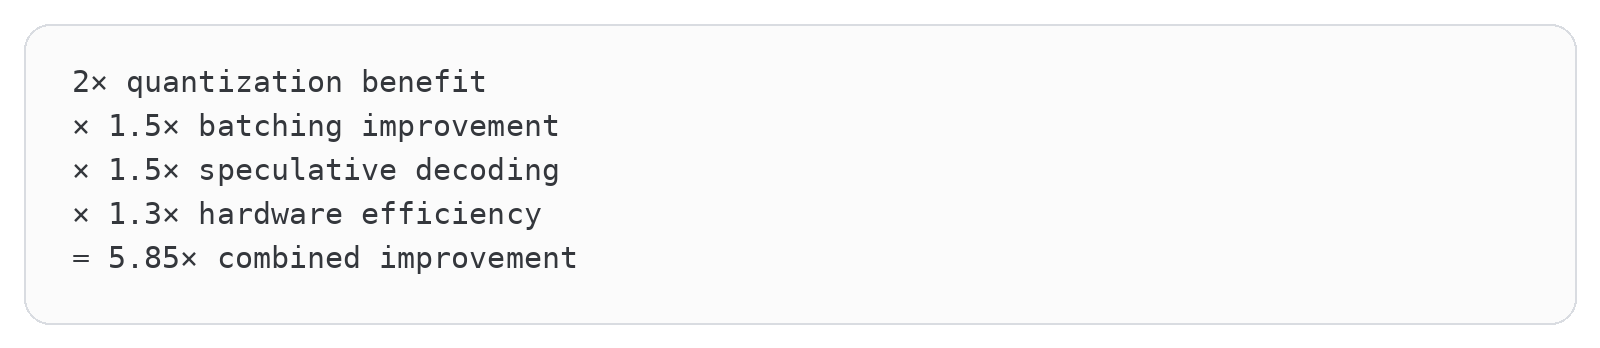
Not every gain multiplies cleanly, and marketing benchmarks love ideal workloads the way real-estate listings love wide-angle lenses. Still, full-stack optimization can move economics faster than any isolated hardware specification suggests.
Finally, the bulls can attack the labor argument. Higher productivity can lower prices, increase real incomes, create complementary tasks and free workers to produce things society previously couldn’t afford. The United States didn’t respond to agricultural mechanization with permanent 80% unemployment. Labor moved, new capital formed and living standards rose. AI could generate new professions that sound as strange to us as “mobile-app developer” would have sounded in 1985.
That is a legitimate case. Any bubble argument incapable of stating it clearly is just doom-flavored content marketing.
Capex can be a moat rather than a mistake
The bull can go further. Capex isn’t merely a burden. It can be a moat. A laboratory with guaranteed access to power, HBM, packaging, networks and frontier accelerators can serve demand that a clever model team with a GitHub repository can’t. When supply is constrained, ownership of the factory protects distribution and reliability. The trillion-dollar commitment isn’t evidence of insanity if it locks competitors out of the only inputs capable of producing the next generation.
Hyperscalers also don’t need every AI dollar to appear as a separate product line. Microsoft can use Copilot to defend Microsoft 365 pricing, reduce churn, win Azure workloads and preserve the developer ecosystem. Alphabet can improve advertising conversion and Search utility. Amazon can optimize retail and make AWS the default home for enterprise models. Meta can improve recommendations and ad yield without charging users for a chatbot. The attributable-revenue problem that frustrates outside analysts can conceal real franchise value inside the company.
Value-based pricing offers the labs a path away from commodity tokens. If an agent completes a task worth $100,000, the customer may happily pay $20,000 even if raw inference costs $200. Software has always captured a fraction of customer value rather than marking up electricity and server time mechanically. Frontier intelligence can become an input to outcomes with enormous consumer surplus.
The frontier itself may keep moving into tasks where cheap models can’t follow. Today’s commodity model writes an email. Tomorrow’s frontier system designs a drug trial, migrates a bank’s core software or coordinates robotic construction. By the time distillation catches the old capability, the premium provider is selling a harder one. This is less like a fixed commodity and more like a staircase:

As long as economically valuable difficulty expands, there’s always another landing on which premium pricing can stand. The lab’s research treadmill becomes a moat because few organizations can afford to run it.
Older hardware may remain useful too. The newest accelerator trains frontier models and serves latency-sensitive agents. Previous generations handle batch inference, embeddings, video processing, scientific computing and distilled models. A secondary market can cascade hardware downward rather than turning it into scrap. Buildings, substations, fiber and cooling outlive the servers. Even if one workload shrinks, cloud operators can schedule another.
Then there’s Jevons paradox in its muscular form. Efficiency doesn’t just reduce cost for the same task. It changes product design. When a task costs $10, an application calls the model once. At ten cents, it calls one hundred agents, samples alternatives, verifies each step and personalizes the result for every customer. Demand isn’t a smooth curve drawn on a whiteboard. Engineers redesign systems around abundance.
Suppose compute per primitive model call falls 20-fold, but an AI-native workflow uses 200 times more calls because it simulates, critiques and retries:
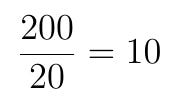
Total compute rises tenfold. The relevant unit keeps changing from token to call, from call to task and from task to an always-on digital workforce. Forecasts based on today’s usage can look silly in both directions.
Labor can adjust faster than historical analogy suggests because AI also teaches. Workers don’t need a four-year credential for every new tool if the model provides interactive instruction. Entrepreneurs can reach customers globally through existing cloud, payment and distribution systems. A displaced analyst can build a niche service with far less capital than a displaced farmworker needed to build a factory. Remote work reduces geographic mismatch for digital occupations.
Finally, the hyperscalers can survive being early. Their balance sheets let them absorb low initial utilization, and strategic overcapacity can prevent competitors from controlling a critical platform. A narrowly measured cluster return may understate option value. Owning compute during a genuine intelligence breakthrough could be like owning cloud infrastructure before every enterprise migrated. The payoff distribution is asymmetric, and missing the upside may be more dangerous than overbuilding.
This bull case is persuasive because every mechanism has precedent: induced demand, platform defense, learning curves, secondary asset markets, new occupations and patient capital. It would be confirmed by falling cost per successful task alongside rising total compute, expanding gross profit, high utilization of old and new hardware, broad customer revenue gains, rapid business formation and healthy labor-market flows. The bear can’t answer it by repeating “capex is high.” The bear has to show that price, demand and useful life fail to line up before the financing clock runs out.
The current financial evidence gives the bulls real ammunition. In Q2 2026, AWS revenue rose 37 percent year over year to $42.2 billion while segment operating income rose to $16.6 billion from $10.2 billion. Google Cloud revenue rose 82 percent to $24.8 billion and operating income reached $8.8 billion. Those are company segment results, not clean AI-only measurements, but they show that the cloud layer isn’t merely lighting cash on fire. Incremental cloud revenue is arriving with substantial operating profit even as consolidated free cash flow absorbs the buildout.
Hardware efficiency is moving too. Nvidia specifies 64 TB/s of aggregate HBM3e bandwidth in DGX B200 and promotes each generation on lower cost per token. Vendor comparisons use optimized workloads and shouldn’t be treated as universal task economics, but they demonstrate that the industry is co-designing accelerators, memory, networking and software rather than waiting for transistor scaling alone.
The bull case can therefore be stated as a testable chain rather than a motivational poster:
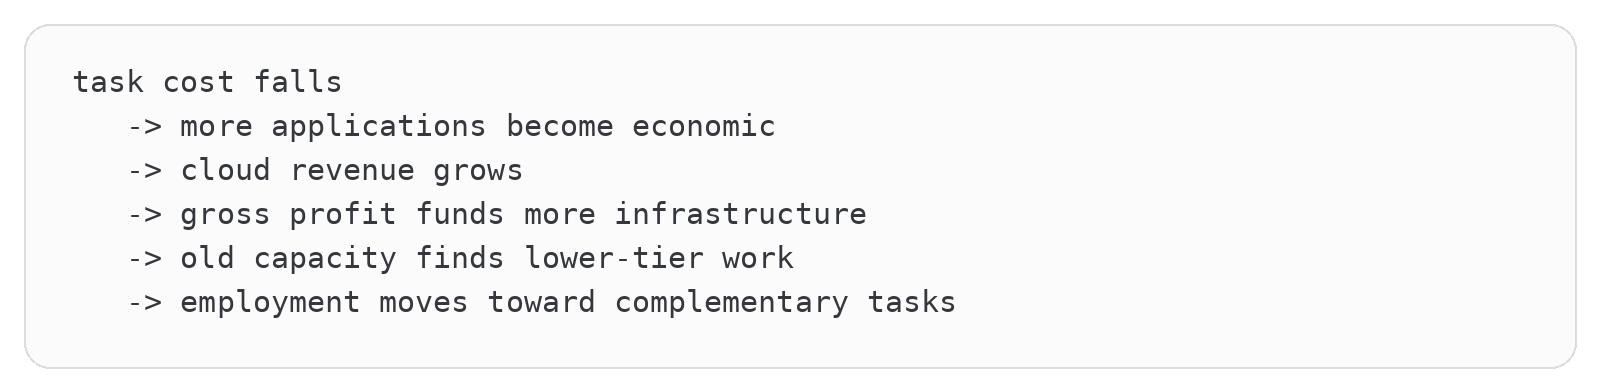
Every arrow needs evidence. Cloud profit supports the third arrow. Falling hardware task cost supports the first. Historical technology adoption supports the possibility of the second and fifth. None yet proves the chain will close at the scale embedded in every lease and valuation.
Chapter 20: When Intelligence Gets Cheaper
Distillation works, and that’s the threat
Remember what we actually financed in the Atlas example: large transformer models, HBM-heavy accelerators, fast scale-out networks and centralized inference. The loan documents don’t magically become shorter because a better architecture appears. Technical progress therefore enters the credit model as duration risk.
DeepSeek has shown how dramatically the current model paradigm can be optimized. Distillation, synthetic data, quantization, mixture-of-experts routing and inference engineering can produce a surprising amount of useful intelligence at a fraction of frontier-model pricing.
The teacher pays tuition. The student copies the notes.
A frontier model learns through an extraordinarily expensive process. It consumes vast datasets, runs experiments, develops internal representations and gets refined through post-training. A distilled student doesn’t need to rediscover every useful behavior from scratch. It can learn from the teacher’s outputs, reasoning traces, corrections, tool trajectories and synthetic examples. Imagine two students preparing for an exam.
The first reads every textbook, attends every lecture, makes every mistake and spends months determining which ideas matter. The second receives the first student’s organized notes, solved examples and explanations of the common traps.
The second student may never know everything the first one knows, but the cost of reaching a useful exam score can be dramatically lower.
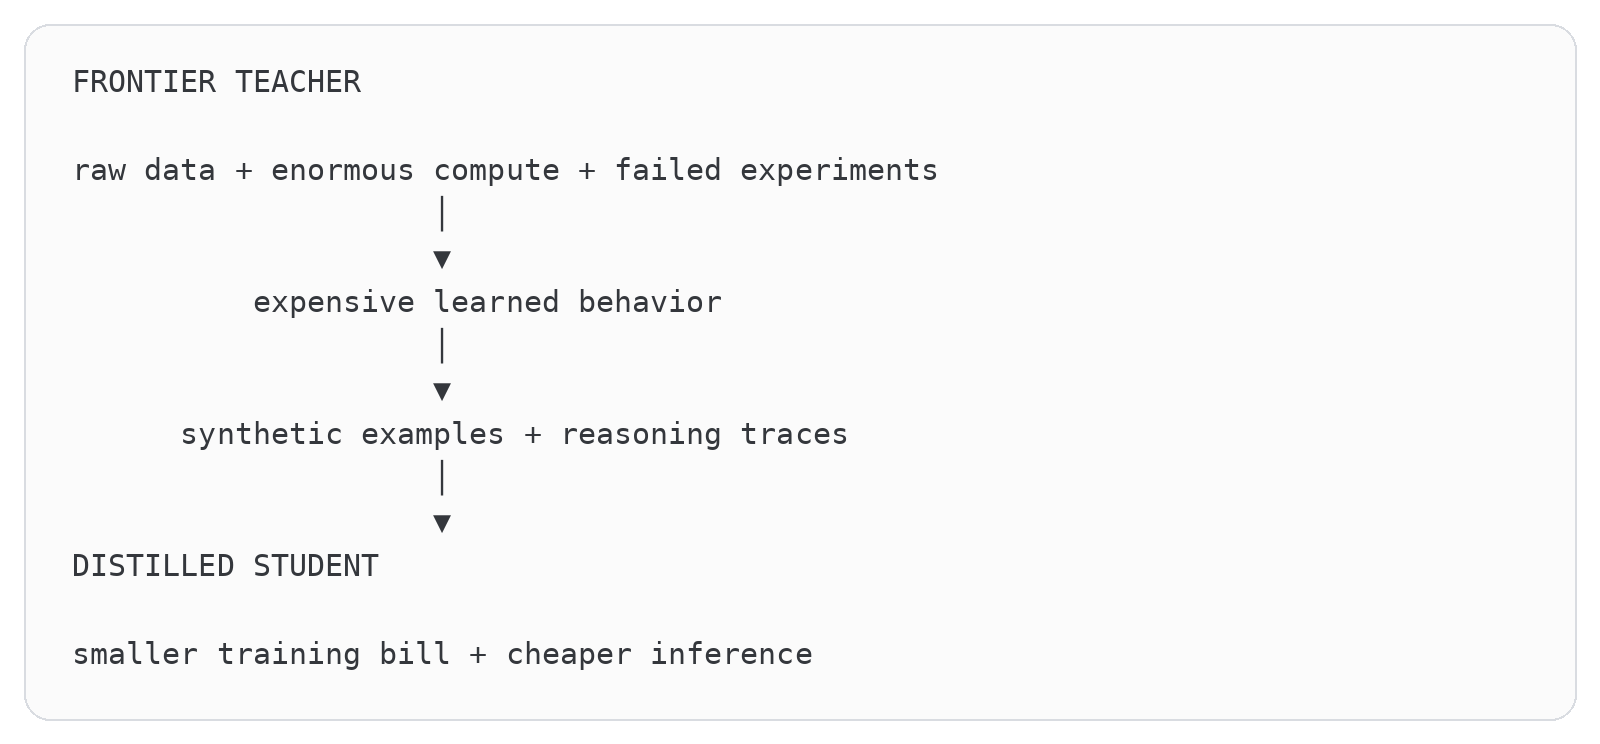
The economic asymmetry is vicious. The frontier lab pays to discover capabilities. Competitors can observe the resulting behavior and compress a meaningful portion of it into cheaper systems. Safety restrictions, API limits and hidden reasoning can slow the process, but public outputs, benchmarks, generated data and open research still transmit information outward.
The teacher creates a temporary frontier. The market turns pieces of that frontier into curriculum.
Distillation doesn’t need to preserve everything
The usual defense is that a 30-billion-parameter student can’t contain everything known by a much larger teacher. That’s probably correct, especially across rare facts, subtle behaviors and the long tail of real-world tasks. It may also be financially irrelevant.
An enterprise doesn’t need the student to preserve everything. It needs the student to preserve the capabilities used in its workload.
Suppose a frontier model reliably handles 100 categories of work. A distilled system preserves only 70. If those 70 categories represent 90% of an enterprise’s request volume, the student can capture 90% of the tokens while remaining obviously inferior in a broad evaluation.
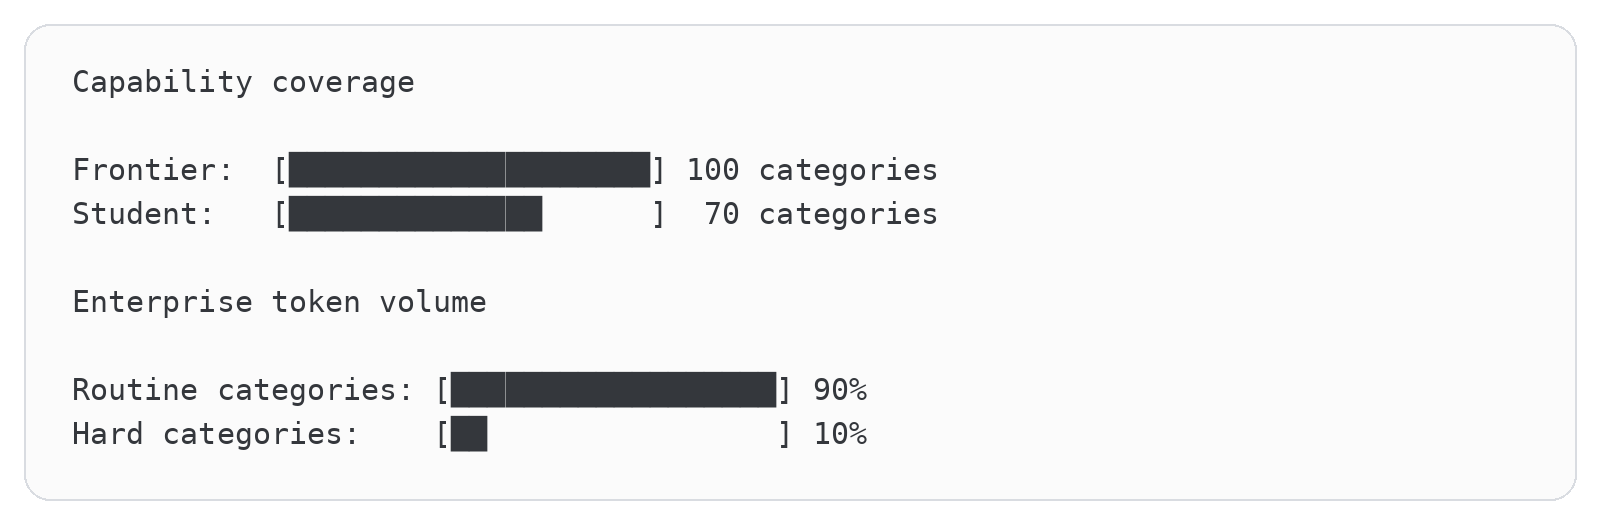
The lab keeps the glamorous 10% of difficult work. The cheaper model takes the boring 90% that paid the bills.
DeepSeek V4-Flash makes the pricing pressure concrete. Reuters reported input pricing of $0.14 per million tokens and output pricing of $0.28, with an estimated benchmark-task cost near three cents. The same comparison placed GPT-5.6 Sol around $1.86 per benchmark task and Claude Fable 5 around $3.15.
Benchmarks aren’t production workloads, and a three-cent benchmark answer can’t be compared mechanically with a complex enterprise agent session. The useful signal is the order-of-magnitude price gap for a system achieving credible general capability.
The challenger doesn’t need to win the frontier crown. It needs to make the crown unnecessary for most requests.
DeepSeek-style systems aren’t necessarily tiny from a storage perspective. An MoE model can retain hundreds of billions of total parameters while activating a much smaller number for each token. It compresses active computation more aggressively than total knowledge storage.
But the economic result matters more than the semantic argument about whether the model is “small.” A cheaper model doesn’t need to beat Claude on every task. It only has to become good enough for an expanding share of ordinary enterprise work.
Enterprises can route classification to a tiny model, extraction to an open model, routine support to a cheap mid-tier system and ordinary coding to a distilled model. Claude or OpenAI receives only the genuinely difficult requests.
The frontier lab doesn’t need to lose the customer. It only needs to lose most of the customer’s tokens.
The lab then becomes the emergency-room surgeon of intelligence. It handles the hardest cases, requires the most expensive infrastructure and gets called less often than the general practitioner.
The frontier labs’ innovator’s dilemma
OpenAI, Anthropic and Google offer smaller models. But “the smallest sufficient model” isn’t the organizing principle supporting their valuations. Their strategies remain centered on:
Producing the smartest frontier system
Expanding reasoning capability
Increasing context length
Running longer agentic workflows
Preserving premium intelligence tiers
Justifying enormous infrastructure investment
An aggressively distilled model is therefore both an opportunity and a threat.
If Anthropic compresses most of Claude’s useful enterprise capability into a model that costs 95% less to run, it improves inference economics. It also teaches customers that Claude’s intelligence wasn’t as scarce as its previous price implied.
The labs need intelligence to become cheaper to manufacture without becoming equally cheaper to buy.
The router is where commoditization becomes revenue loss
A cheap model doesn’t automatically steal work from an expensive one. Somebody has to decide which model receives each request. That somebody is increasingly a router.
Think of a hospital intake desk. A patient with a cold doesn’t need the chief surgeon. A patient with a ruptured artery probably does. Sending everybody to the surgeon is expensive and slow. Sending everybody to the cheapest nurse is dangerous. The intake system creates value by matching case difficulty to the least expensive resource likely to succeed. An AI router performs the same job:
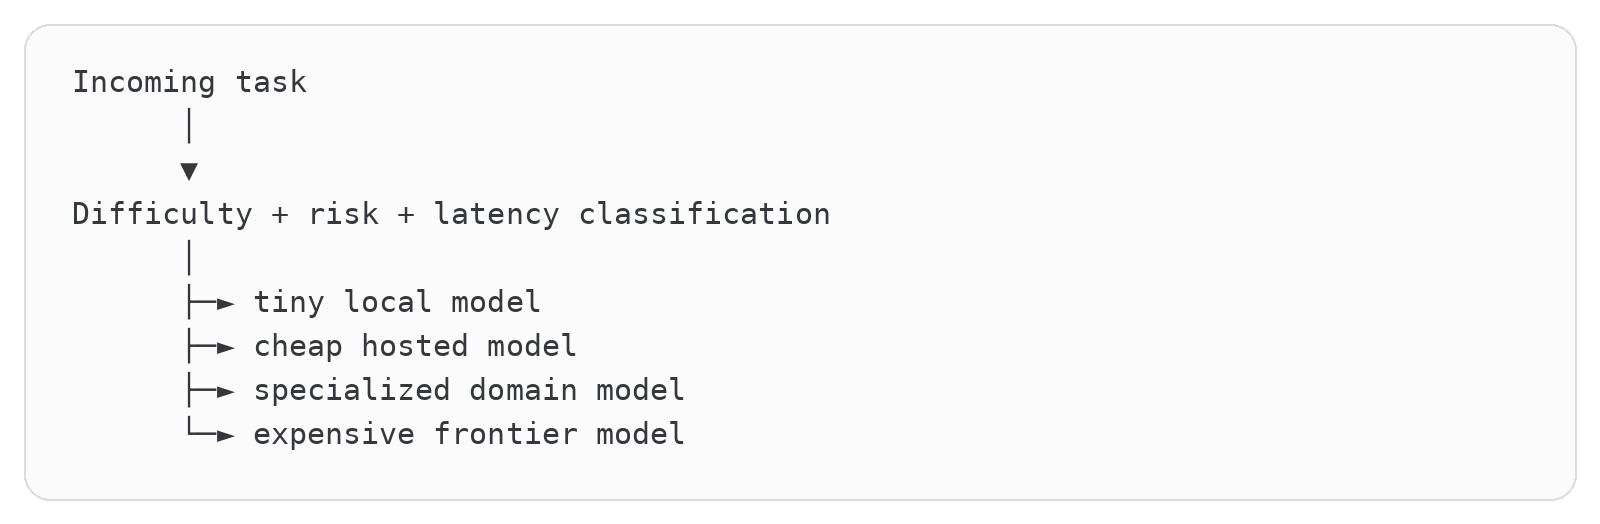
The enterprise objective isn’t to use the smartest model. It’s to minimize the expected cost of a correct outcome:

For classifying a support ticket, failure cost is small and the cheap model wins. For approving a wire transfer or changing production infrastructure, failure cost dominates and the expensive model may be rational. Routing turns “good enough” into an economic category rather than an insult.
Suppose a frontier provider initially receives every request because it’s clearly best. A cheaper model improves until a router can safely divert 60% of tasks. The frontier provider keeps the customer relationship and may still appear in the architecture, but its billable volume falls dramatically.
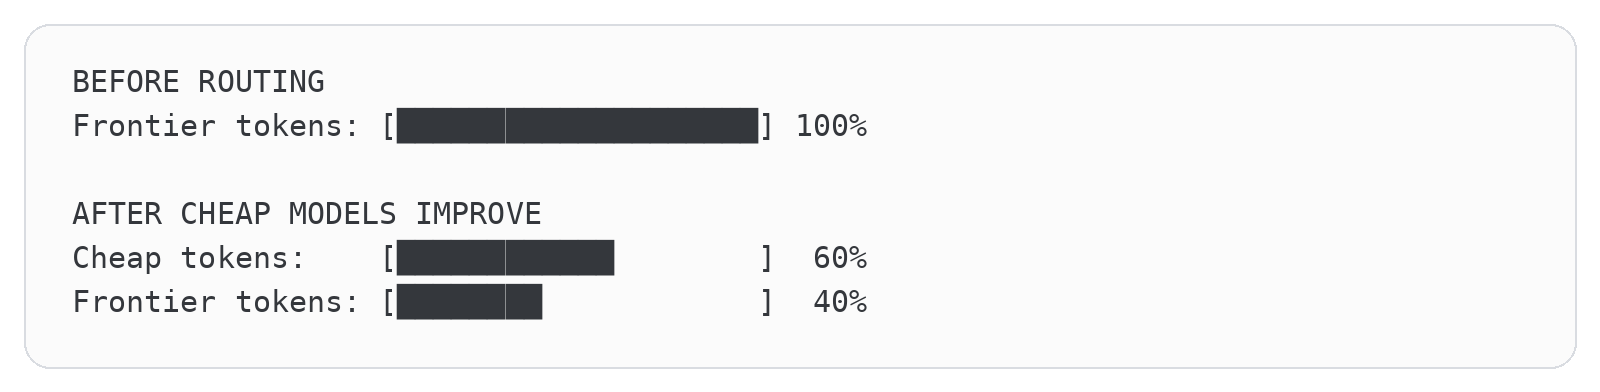
The remaining 40% may be disproportionately expensive to serve. Hard tasks use longer contexts, more reasoning, additional tools and more retries. Commodity volume leaves while complex inference remains. Frontier revenue can fall faster than frontier production cost.
Routing is therefore the mechanism connecting technical convergence to financial commoditization. The cheap model doesn’t need better branding, a beloved chatbot or a direct enterprise sales force. It can enter quietly as the invisible worker beneath somebody else’s product.
For Atlas, the router is effectively a tiny capital-allocation committee making decisions millions of times a day. Each request sent to a smaller model, custom accelerator or older cluster is one less chance for Atlas’s premium B200 capacity to earn its assumed rate. Each difficult request retained may carry a higher price, but it can also bring longer contexts, worse batching and more retries. The router doesn’t care what Atlas cost to build. It chooses the cheapest system that can complete the task acceptably.
Strategic value may migrate toward whoever controls evaluation, routing, caching, workload history and the definition of task success. That layer learns which model works for which customer under which constraints. Model providers become interchangeable suppliers beneath an orchestration system holding the real customer relationship.
This is the nightmare hiding behind “multi-model flexibility.” It sounds like a product feature because it is one. It’s also a procurement department with an API.
World models are the architectural dark horse
Distillation optimizes the current paradigm. The student still learns to predict tokens using behavior generated by a larger teacher.
World models raise a more disruptive possibility: what if useful reasoning doesn’t always require predicting every surface detail?
A world model attempts to learn compact representations of how a domain changes:

Instead of predicting every pixel or word, some architectures predict a compressed latent representation containing what matters for planning.
The word latent sounds mystical, but it only means a hidden internal representation. Imagine describing a chess position. A photograph contains millions of pixel values, wood grain, shadows and fingerprints on the board. A useful chess representation needs piece identities, locations, whose turn it is and perhaps castling rights. Almost every visual detail can be thrown away without harming the decision.
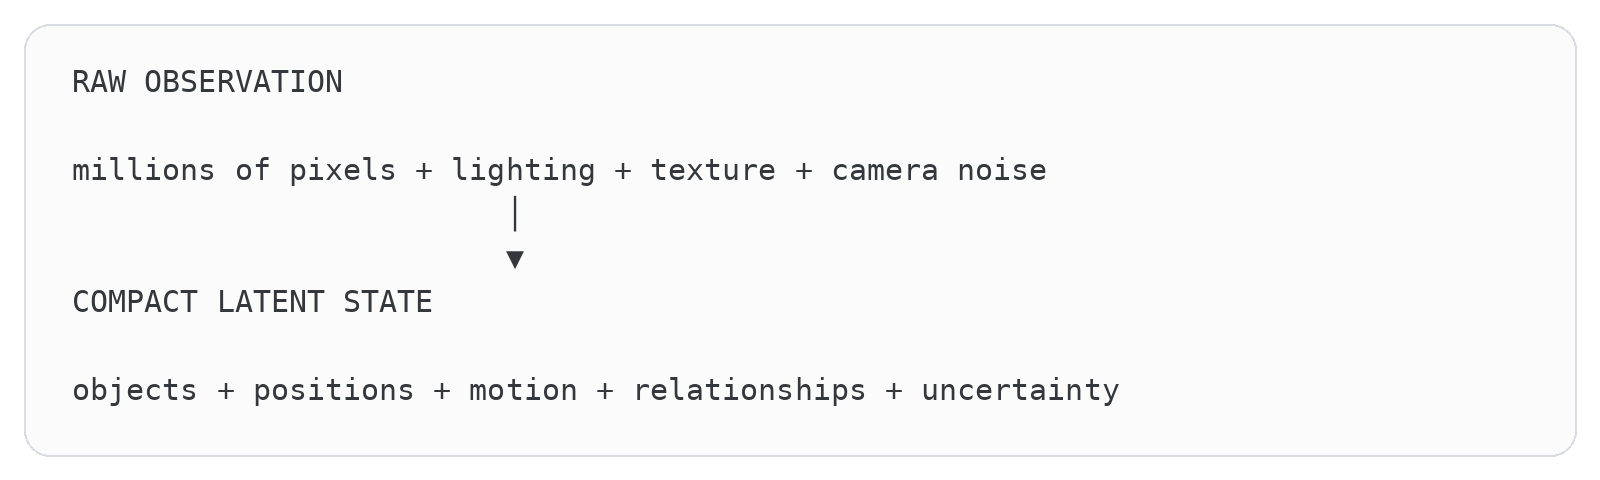
If the compact state preserves what matters, planning can happen inside a much smaller space. Instead of generating every possible future pixel, the model predicts how the useful state changes after an action.
A video generator predicting a ball rolling down a hill may model every blade of grass, shadow, reflection and texture. A compact world model may only need the ball’s position, velocity, slope, friction and likely trajectory.
If an intelligent system learns the underlying operation rather than memorizing an enormous distribution of examples, it may require dramatically less parameter memory for some forms of reasoning.
But world models haven’t demonstrated general-purpose frontier capability across language, programming, medicine, law, science and open-ended research. A general world model could still be enormous, and future systems may combine an LLM, world model, external factual memory, planner, verifier and specialized experts.
The accurate claim isn’t that world models will definitely make frontier AI tiny.
It’s that they may change the unit of intelligence by replacing some brute-force token prediction with more compact representations of structure, causality and future states.
There’s real progress, but it’s narrow progress
NVIDIA’s Cosmos platform shows that world models are no longer only a research slogan. Cosmos Predict generates future world states from text, images and video, while Cosmos Transfer converts structured simulation inputs into photorealistic data for robotics and autonomous-vehicle training. NVIDIA reports that its visual tokenizer achieves eight times greater compression and twelve times faster processing than prior leading tokenizers. Companies including robotics and autonomous-driving developers have used the system for synthetic data, scenario variation and policy development.
Research prototypes show how compact latent prediction can become. LeWorldModel uses approximately 15 million parameters, trains on a single GPU in a few hours and reports planning up to 48 times faster than foundation-model-based world models across a set of two- and three-dimensional control tasks.
That’s impressive. It also doesn’t mean a 15-million-parameter system is about to replace Claude in corporate finance. Moving blocks through a controlled visual environment is not equivalent to knowing tax law, debugging a distributed database and explaining a medical paper in the same afternoon.
The research itself exposes the unresolved problems. Latent systems can collapse into representations that ignore actions or omit physical variables necessary for planning. Delta-JEPA was explicitly designed to preserve action-sensitive changes in the latent state. PhyLatent identifies failures involving physical invariance, state identifiability and counterfactual dynamics.
These aren’t footnotes. A compressed representation is useful because it discards information. The entire challenge is discarding the irrelevant information without casually deleting the variable that causes the car crash.

World models are therefore a dark horse, not a scheduled product launch. Their financial relevance comes from asymmetric timing. They can remain scientifically immature today and still arrive before a fifteen-year data-center obligation finishes paying for itself.
They may complement transformers and still strand assumptions
The likely future isn’t necessarily “world models replace LLMs.” A capable system may use a language model for communication, a world model for simulation, retrieval for factual memory, specialized experts for domains, a planner for long-horizon action and a verifier for high-risk outputs.
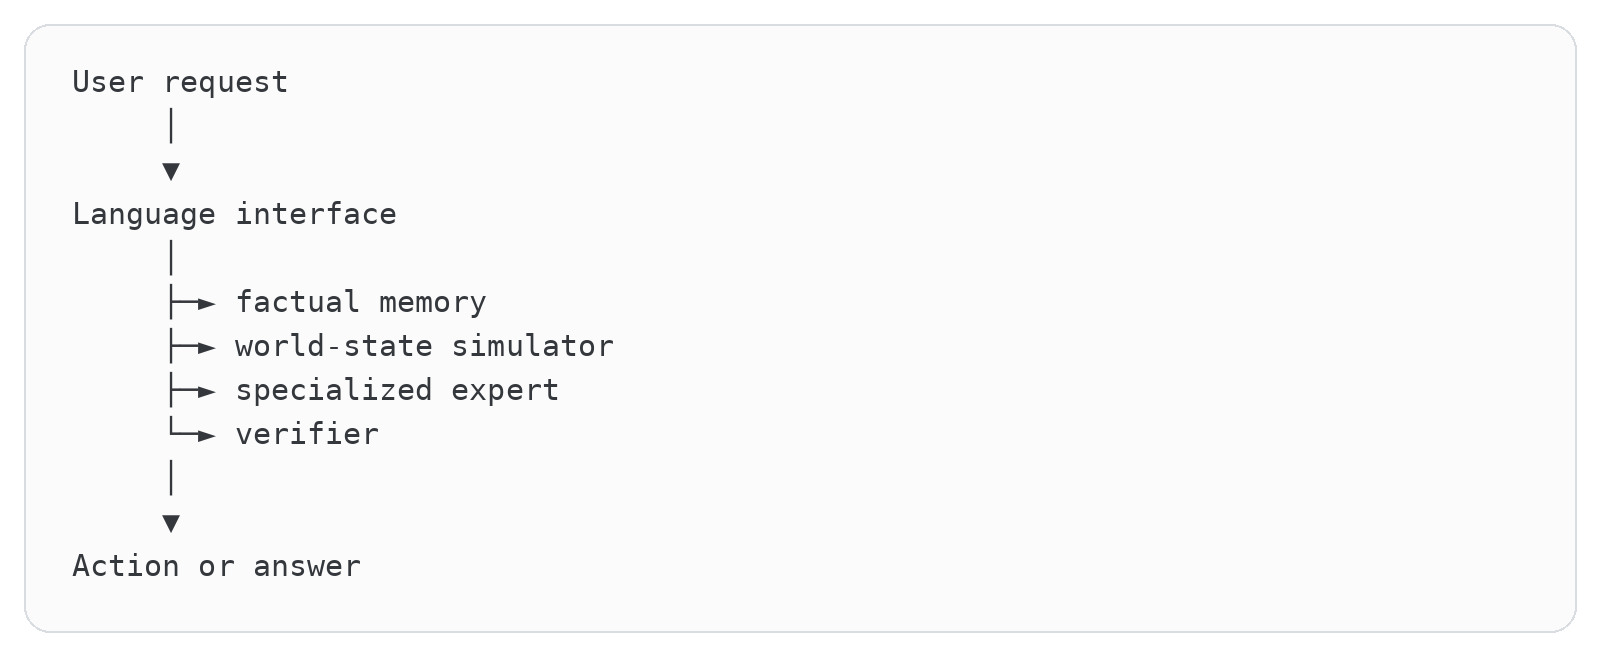
That hybrid can still threaten current forecasts. If a compact world-state module reduces the amount of brute-force token reasoning required for planning, the system may complete more useful work per generated token. Token demand can underperform even while AI capability and adoption exceed expectations.
Infrastructure investors aren’t betting only that AI grows. They’re implicitly betting on the computational shape of that growth. A future system that uses transformers but requires one-tenth as many sequential reasoning tokens can be wonderful for customers and awkward for a facility financed around permanently exploding token volume.
The timing is what makes world models financially dangerous
The AI industry is making infrastructure decisions now. Labs and cloud providers are financing data centers, memory capacity, power generation, networking and transformer accelerators around assumptions about the next decade of demand.
World models may not mature quickly enough to solve the current compute problem. But they don’t need to arrive tomorrow to threaten the current financing structure.
A data-center lease signed today may still have a decade remaining when a different architecture becomes commercially useful.
Architecture Can Change Before the Financing Expires
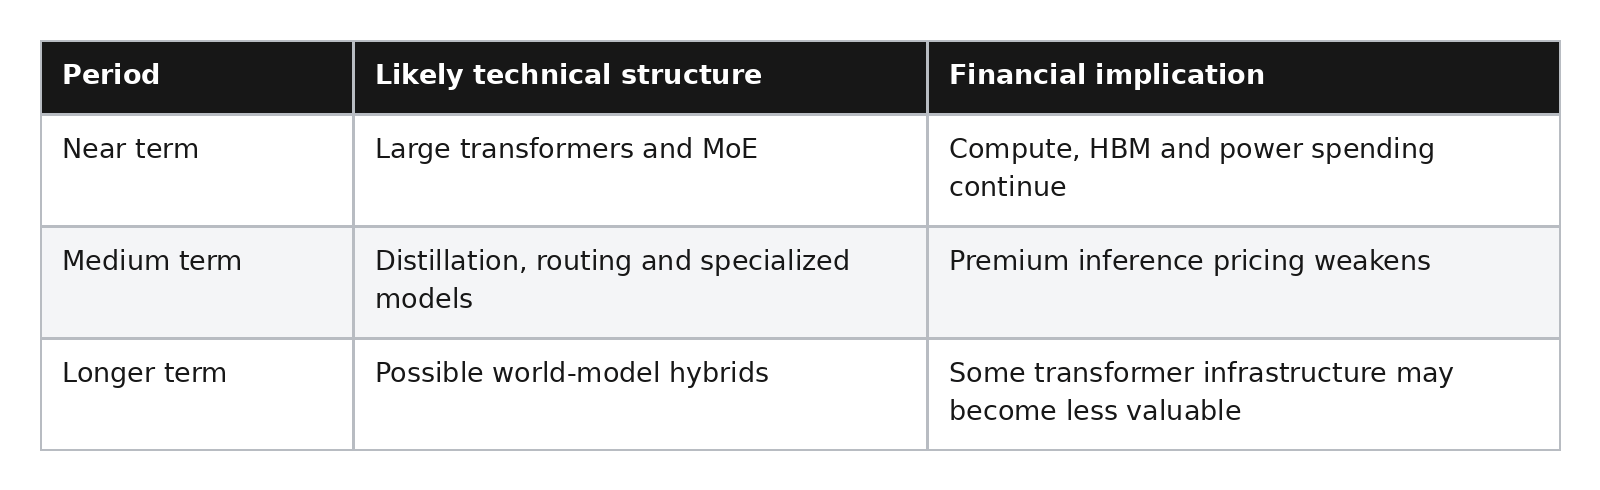
World models may arrive too late to solve the current compute crisis, but early enough to strand infrastructure built around it.
Chapter 21: The Timing Mismatch
Why a technology bull case is not automatically an investment bull case
The bull case demonstrates that AI can justify enormous long-run investment. It doesn’t demonstrate that every current valuation, contract and project earns an acceptable return.
Induced demand may flow toward the cheapest models rather than the most expensive providers. New applications may generate consumer surplus without software-like lab margins. Hardware efficiency may increase utilization while shortening the economic life of older clusters. New jobs may appear after a painful transition rather than before displacement. Infrastructure can be socially valuable and financially overbuilt at the same time. The crucial distinction is between three winners:
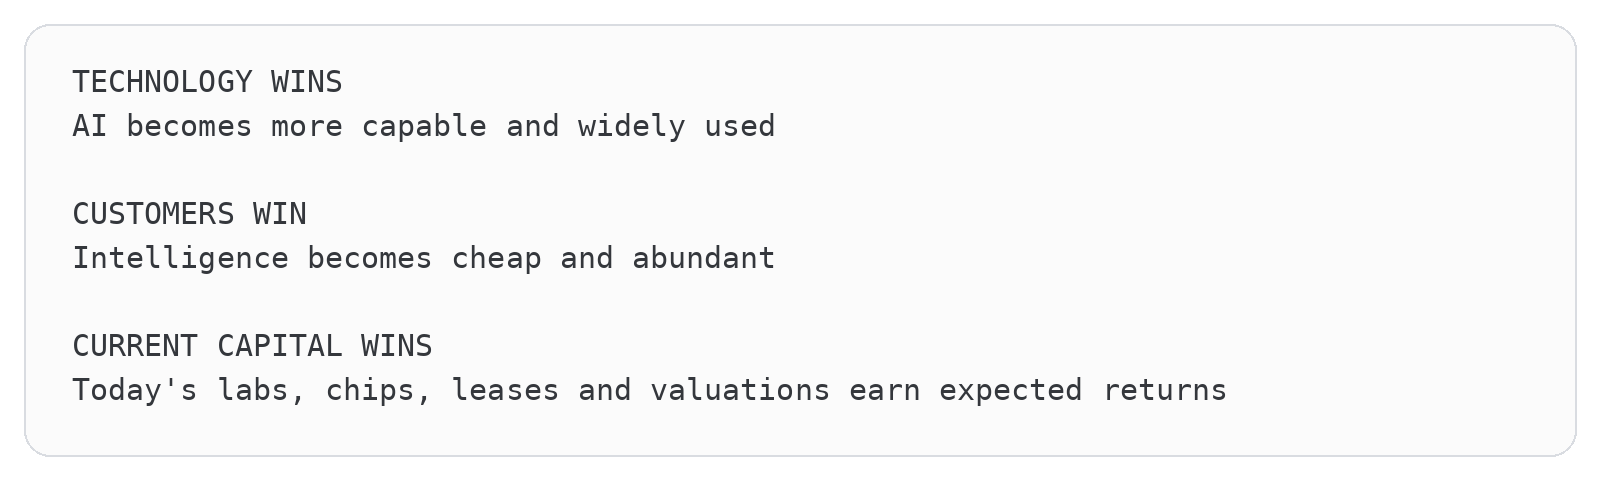
The first outcome makes the second plausible. Neither guarantees the third.
The dot-com analogy survives precisely because the internet ultimately exceeded the bulls’ wildest social predictions while many period investments still failed. Technological importance and investor return are related, but they aren’t married. Sometimes they exchange numbers at a conference and never speak again.
The strongest version of the dot-AI thesis therefore accepts nearly the entire technology bull case. Models improve. Usage grows. New industries appear. Productivity rises. Intelligence becomes embedded everywhere.
Then it asks the irritating capitalist question: who captures the cash after competition, depreciation, energy, financing and labor-market adjustment?
The three technical futures
The industry faces three technical futures, and every one creates a different financial problem.
Three Technical Futures, None Especially Convenient
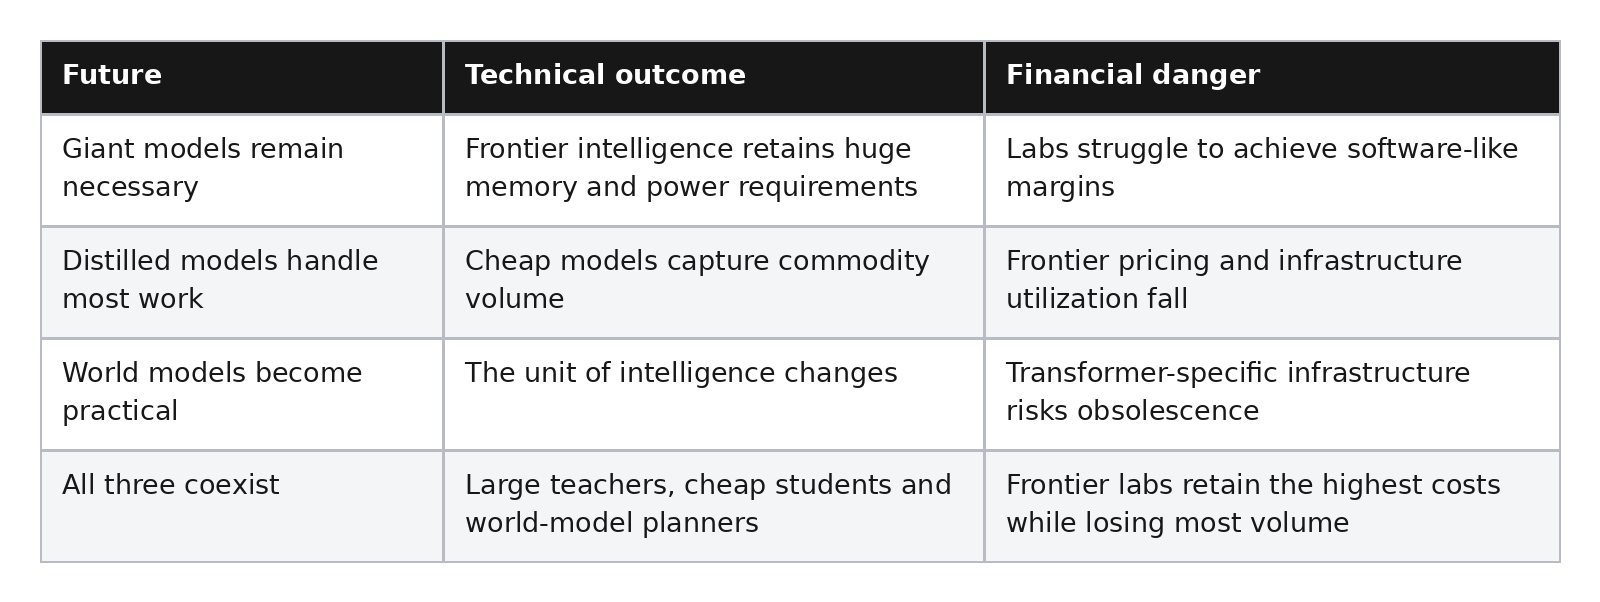
The fourth outcome may be the most realistic. Giant models remain useful as teachers, research systems and difficult-task fallbacks. Distilled models handle most production workloads. World models take over parts of planning and simulation. That would be excellent for AI adoption.
It could be brutal for companies valued on the assumption that every useful task will indefinitely require huge amounts of centralized frontier inference.
Chapter 22: When Efficiency Comes for Atlas
We can now run the bull case through the same project rather than applauding it in the abstract. Atlas earns revenue from realized price multiplied by billable volume. Better models, quantization, batching, speculative decoding and routing can increase the number of useful tasks each accelerator completes. That is technically bullish. Financially, the result depends on what happens to price and utilization.

If task cost falls 80 percent and induced demand increases tenfold, the factory can be busier and more profitable. If task cost falls 80 percent while premium demand increases only threefold, customers win while revenue attached to the old capacity falls. If distilled models take commodity work but Atlas retains difficult agents with long contexts and expensive retries, it may lose the cheap volume and keep the ugly requests. None of these outcomes can be inferred from a token-price chart alone.
The same symmetry applies to hardware reuse. A secondary market and lower-tier workloads protect residual value, which materially strengthens Atlas. But if every generation sharply reduces cost per successful task, the asset can remain useful while its rent falls below the price assumed by its financing. The bull and bear are not arguing about whether efficiency is good. They are arguing about who captures it, how much additional demand it induces and whether the cash reaches the old capital before replacement is due. That gives us a complete bullish chain:
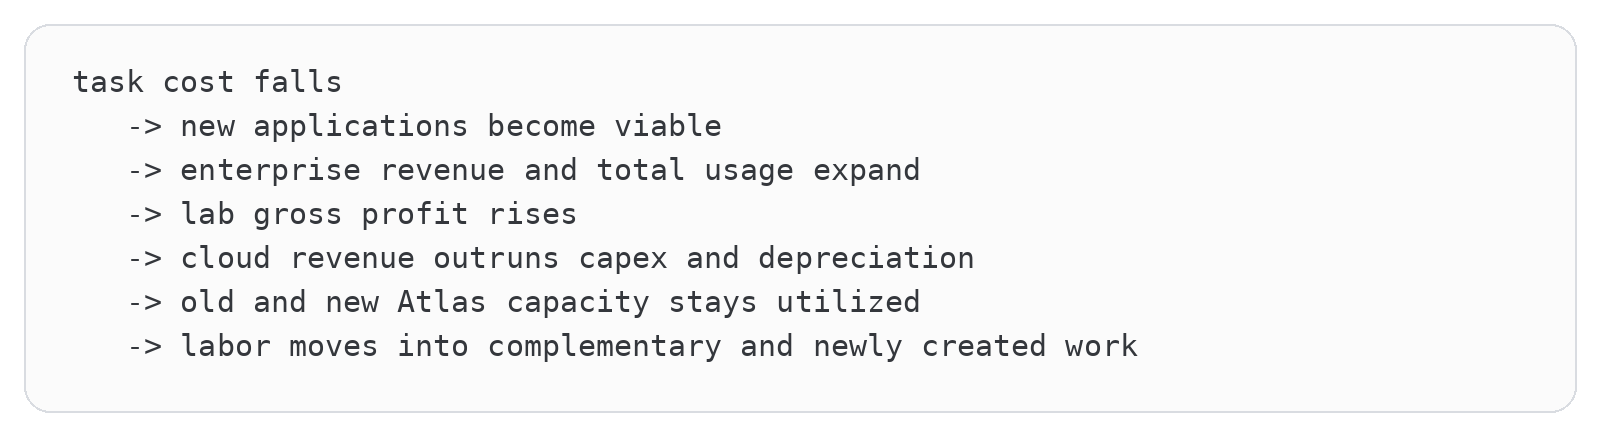
Every arrow is measurable. The article’s bear case survives only if one or more arrows fail before the financing clock runs out. That is a much stronger claim than “capex is high,” and it is also much easier to prove wrong.
Part VI: What Happens If the Dollar Arrives Late?
Chapter 23: Circular Financing
The financial structure makes the architectural risk spread beyond the labs.
Cloud providers invest in frontier labs. The labs commit to buying cloud capacity. Those commitments support reported cloud backlog. The backlog helps justify new data centers, chip orders, power contracts and private-credit vehicles. Suppliers report enormous AI demand, which supports valuations and makes more capital available to the same ecosystem.
The revenue isn’t necessarily fake. But parts of the system aren’t economically independent.

These relationships work beautifully while model revenue keeps compounding. If a lab misses its targets or renegotiates a compute agreement, the disappointment travels outward through cloud backlogs, chip orders, memory suppliers, data-center leases, debt vehicles and utility commitments. The duration mismatch is the problem:

The trouble is that those obligations are backed by:

Chapter 24: Repricing Atlas
A memory shortage alone probably won’t pop the bubble. In the short run, scarcity raises HBM prices, supplier margins and the apparent urgency of every order. A bubble breaks when a technical or commercial miss changes someone’s willingness to provide the next dollar of capital. There are several paths, and they don’t all end in a 2008-style explosion.
Scenario one: soft valuation repricing
This is the boring and probably most survivable path. A frontier lab reports spectacular revenue but gross margin stalls. Investors reduce the multiple they’ll pay for future revenue. No customer disappears and no server shuts down.
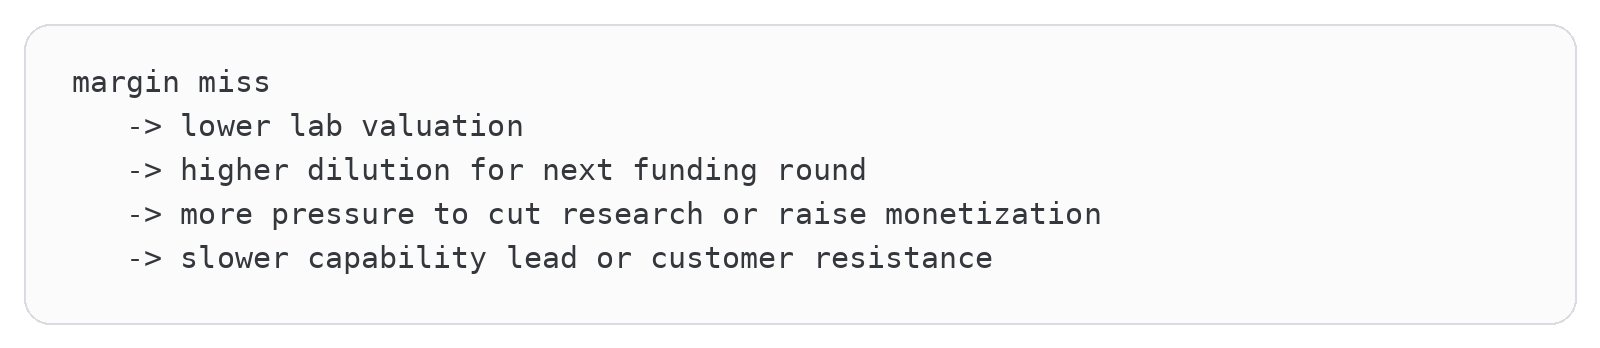
Private marks fall first. Public application companies with thin moats reprice next. Hyperscalers may absorb the hit because cloud and advertising cash flows remain enormous. Chip and power orders continue until the lower valuation changes actual financing or demand. In this scenario, equity holders take most of the early loss and the physical buildout slows gradually.
Scenario two: capital strike
A capital strike occurs when labs can still raise money, just not enough at acceptable terms to fund their commitments. Imagine a laboratory needs $80 billion of new capital, but investors offer $30 billion at a down valuation. Management delays training runs, stretches suppliers and renegotiates capacity.

The gap travels to cloud providers as reduced backlog confidence. Cloud providers slow orders to Nvidia, AMD, memory suppliers and builders. Equipment vendors initially point to backlog, but cancellation clauses, delivery schedules and customer concentration become the whole game. Construction contractors lose projects not yet underway. Projects already financed may continue because stopping halfway destroys more value than finishing.
Scenario three: Atlas loses its anchor tenant
Now bring the transmission path home. Atlas’s anchor laboratory represents 40 percent of billable revenue, or about $130.6 million in the base case. Suppose the lab doesn’t vanish but cuts committed consumption in half after routing ordinary work to cheap models and renegotiates the remainder at a 20 percent discount. Atlas loses about $78.4 million of annual revenue before remarketing capacity. Assume only $10 million of operating expense disappears because most facility, network, labor and support cost remains fixed. Site EBITDA falls from $216.5 million to roughly $148.1 million.
Cash available for debt service after $12 million of maintenance capex and $5 million of cash taxes falls to about $131.1 million. Against $111.3 million of scheduled debt service, DSCR compresses from roughly 1.79 times to 1.18 times. The project still pays. It has almost no room for another pricing miss, outage or delayed replacement cycle.
If the anchor stops paying entirely and the capacity can’t be remarketed during that year, revenue falls by the full $130.6 million. Even allowing $15 million of avoided variable cost, site EBITDA drops to about $100.9 million. After maintenance capex and taxes, cash available for debt service is around $83.9 million and DSCR falls to approximately 0.75 times.

The facility hasn’t exploded. The covenant has.
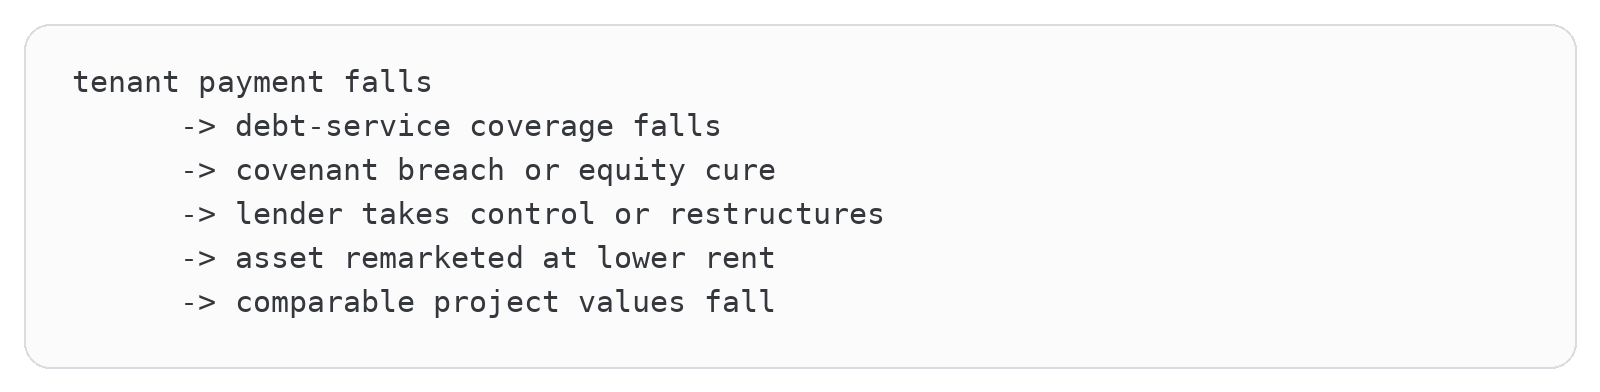
Debt-service coverage is simply cash available for debt service divided by required debt service:

The lender can demand more equity, restrict distributions, raise pricing or restructure. Equity in Atlas takes the first loss. Junior debt and private credit follow. Senior secured lenders may ultimately own a collection of assets whose recovery values differ radically:
What Atlas Can Recover After Losing Its Anchor Tenant
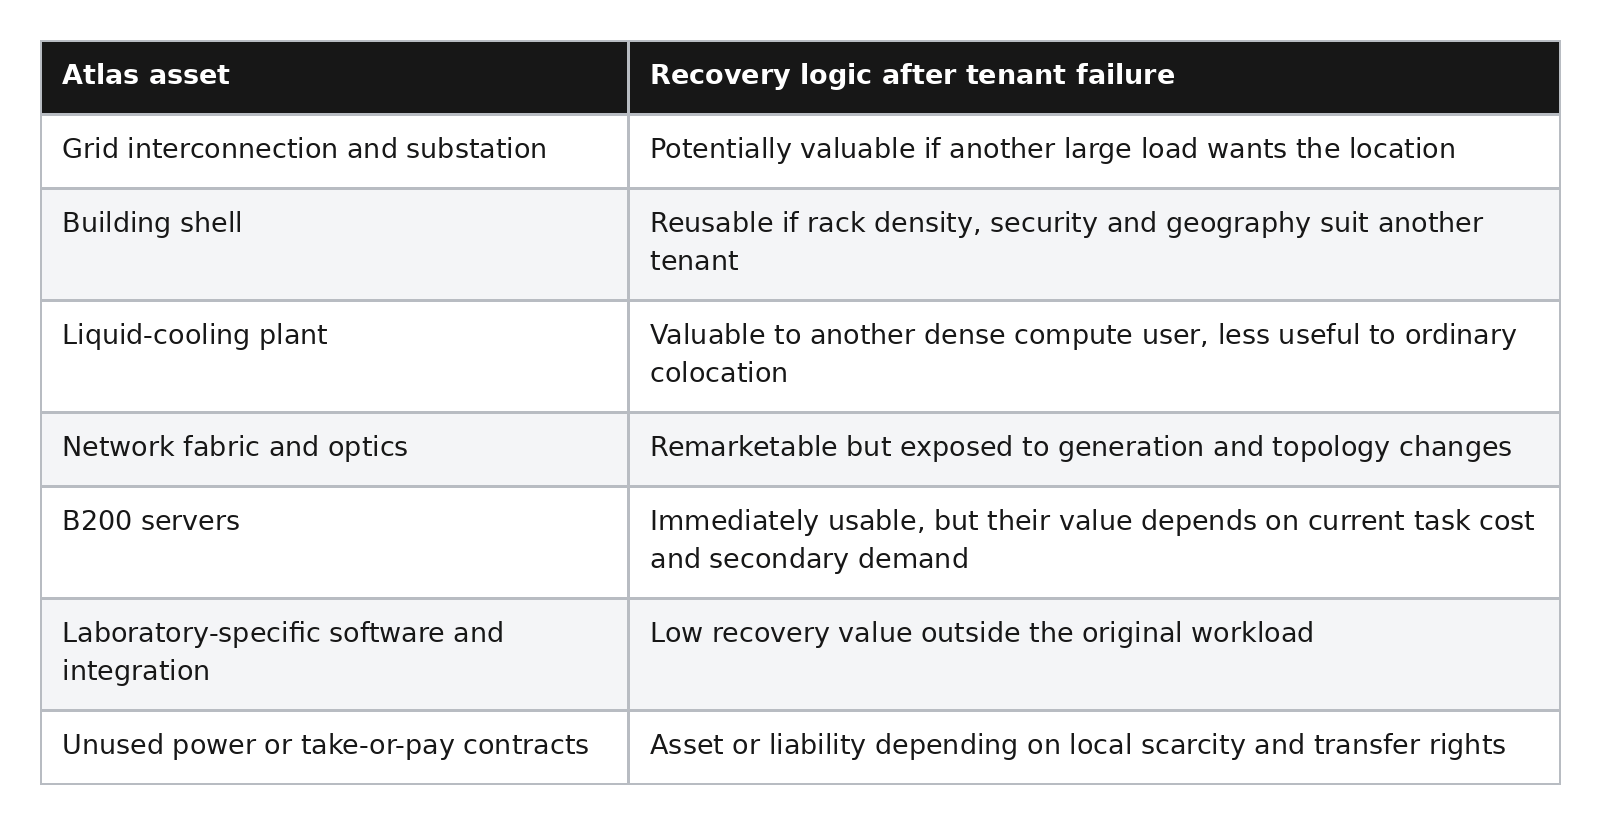
The first-loss sequence is therefore concrete:
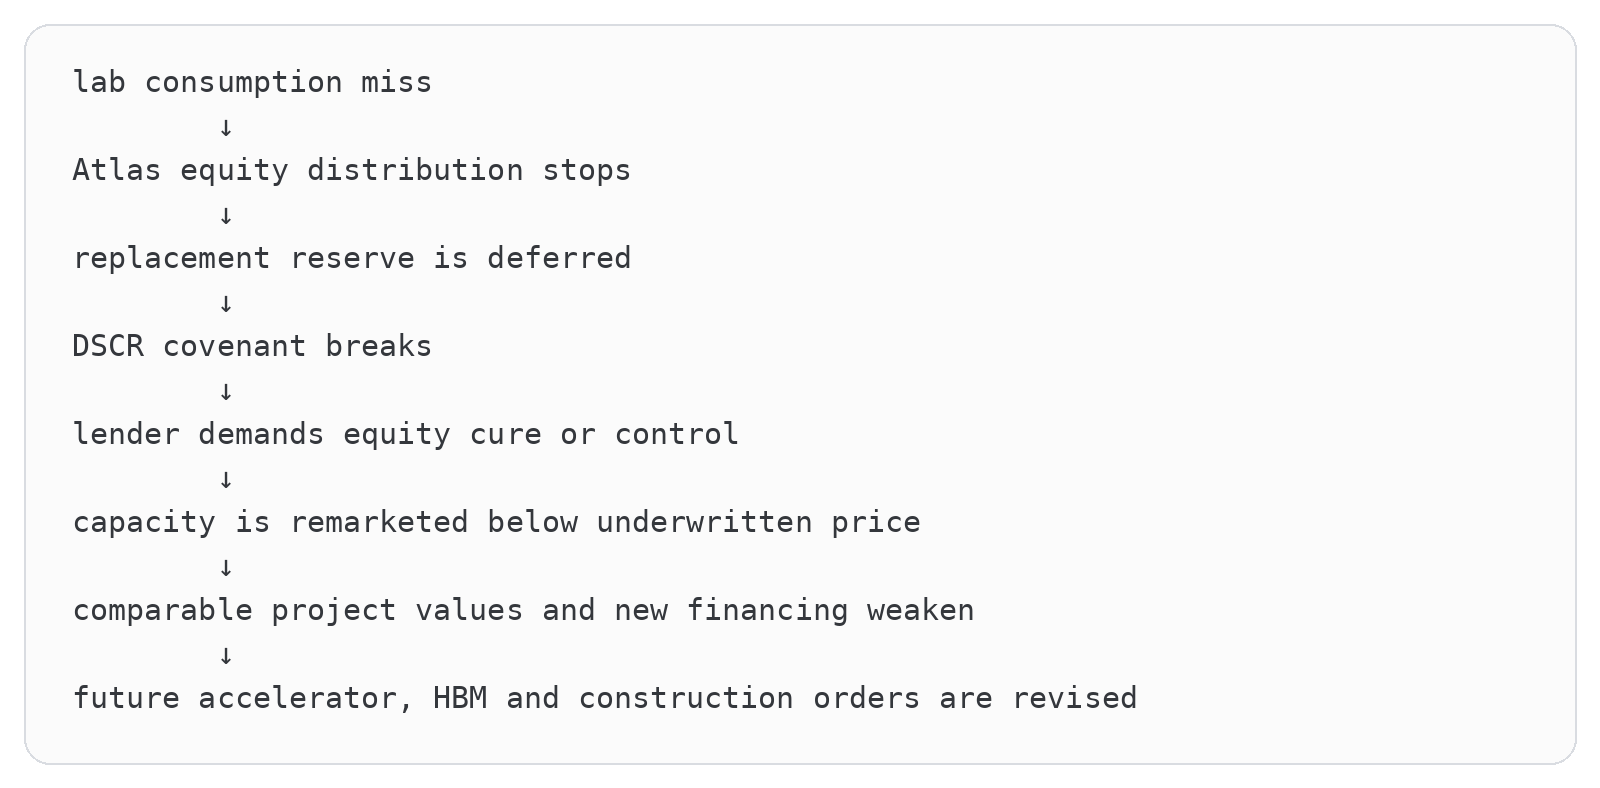
Scenario four: cloud-backlog revision
Cloud backlog is a promise about future revenue subject to contract terms and capacity delivery. If a lab’s expected consumption falls, analysts revise hyperscaler growth. The direct revenue effect may be years away, but the market reprices immediately because today’s capex was justified by tomorrow’s utilization.
Hyperscalers have an advantage: they can redirect generic capacity to databases, enterprise cloud, internal models or other customers. Reuse reduces the loss. Specialized high-density campuses in constrained locations are harder to repurpose. The accounting consequence may be lower returns rather than an immediate impairment. Depreciation continues through cost of revenue while revenue arrives more slowly, compressing cloud margins.
Scenario five: hardware-order correction and the HBM cycle
Semiconductor corrections begin when customers realize they have enough inventory relative to revised deployment. Orders are reduced before end-user AI demand necessarily falls.
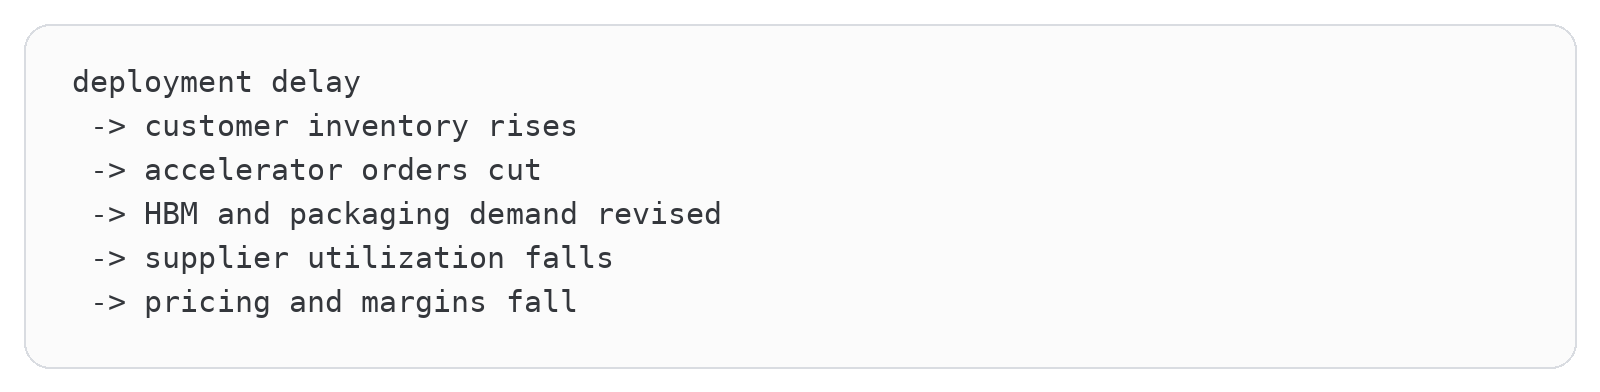
HBM suppliers can be protected initially by contracts and qualification barriers. But memory manufacturing has high fixed cost. Once new capacity arrives into weaker orders, small utilization changes have large margin effects. Networking, optical and cooling vendors experience their own inventory corrections at different times because the bill of materials isn’t ordered on one synchronized clock.
Nvidia can remain highly profitable through a correction if customers still race to the newest generation and its software moat preserves pricing. The most vulnerable holders may be owners of the previous generation, not the designer of the next one. AMD can gain share in a slower market and still face weaker total demand. Market share and market size are different variables.
Scenario six: utility and construction spillover
Regulated utilities generally don’t resemble speculative startups. Approved investments can earn regulated returns, and grid assets may serve broad demand. Risk rises when infrastructure is unusually tenant-specific, costs are assigned to ordinary ratepayers or regulators disallow recovery after a project disappears. Merchant generators and dedicated onsite plants bear more direct utilization and fuel-price exposure.
Construction firms lose backlog when planned campuses are canceled, but completed roads, substations and transmission may retain public value. Local governments can be left with tax incentives, infrastructure obligations or underused land. Workers face a conventional construction cycle: layoffs arrive after projects finish and the next wave fails to start.
Scenario seven: technological stranding
This is the happy-for-users crash. Distillation, routing, custom silicon or a new architecture drops useful-task cost so quickly that demand explodes but frontier accelerator-hours underperform forecasts.

If tasks increase fivefold while compute per task falls tenfold, total compute demand halves. Jevons paradox loses in that particular interval. Applications flourish, customers save money and old clusters reprice. The technology wins. The asset owners who financed permanent scarcity don’t.
Scenario eight: labor-driven demand shock
This is the slowest and most speculative path. Broad hiring suppression and wage pressure weaken household consumption. Customer revenue disappoints. CFOs pursue more automation to protect margins, reinforcing the loop. Monetary and fiscal policy can offset the shock, lower prices can restore real demand and new industries can absorb workers, so this isn’t an inevitable depression machine. It belongs in the scenario set because the labs’ revenue strategy is increasingly tied to the very labor budgets that support aggregate demand.
Who loses first?
Who Gets Hit First When the AI Trade Reprices
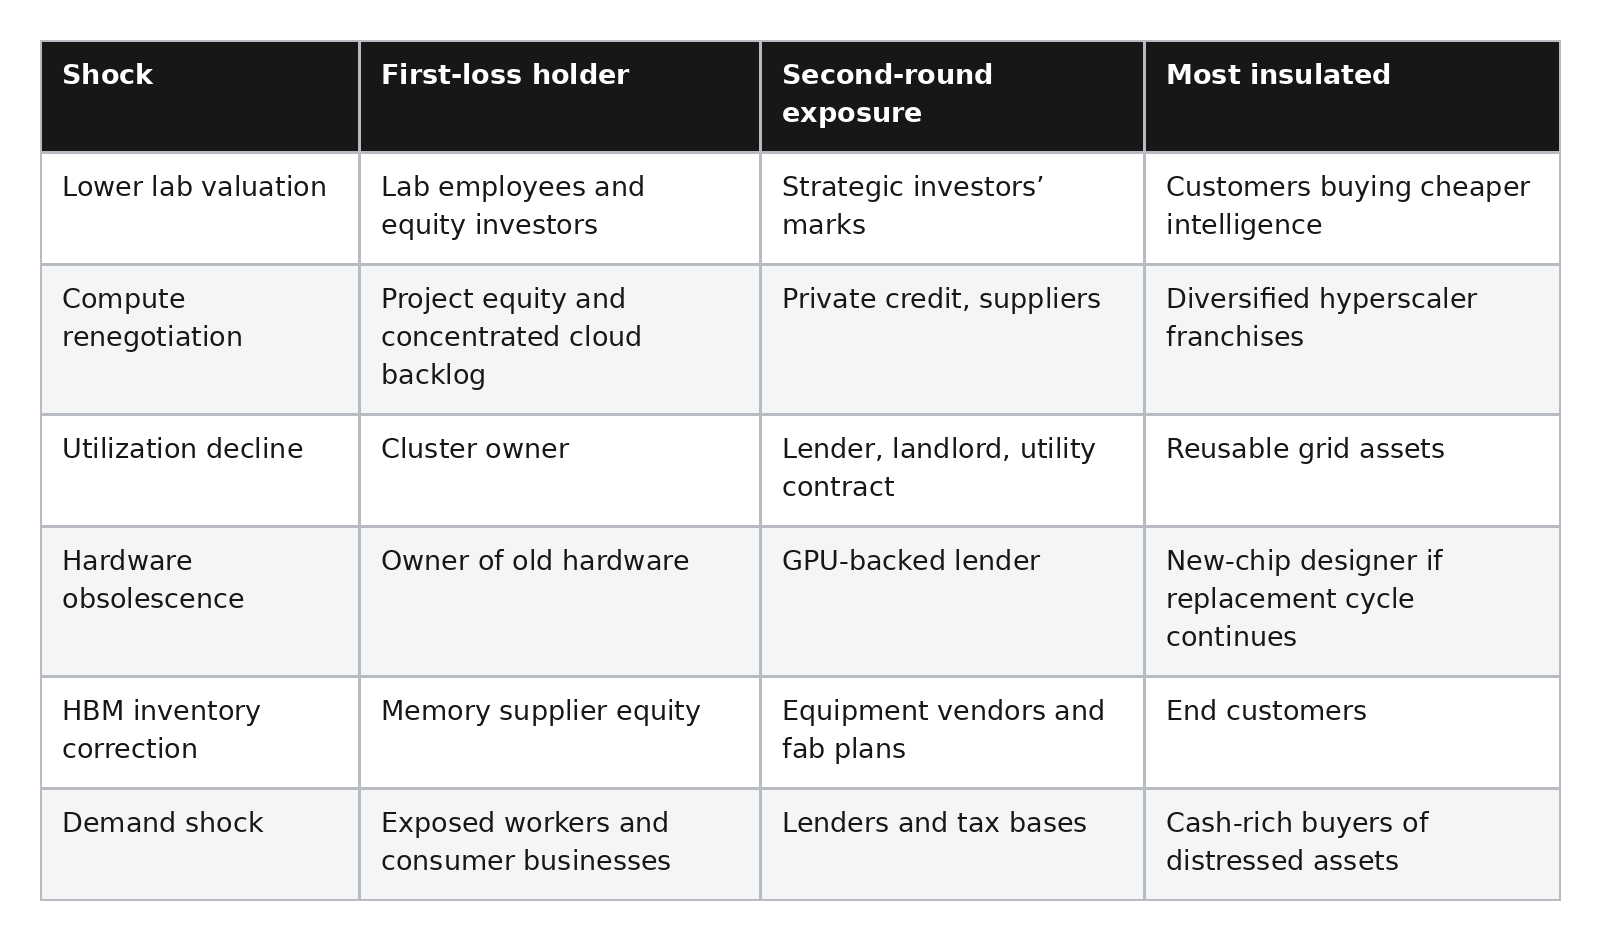
The crisis may therefore look less like Lehman and more like telecom after 2000: equity wiped out in specific vehicles, assets sold cheaply, suppliers suffering an inventory cycle and surviving platforms buying useful infrastructure from owners who financed it badly. Credit matters because debt turns a disappointing return into a forced transaction. But hyperscaler balance sheets and the reusability of some infrastructure make a single synchronized collapse less certain.
What would falsify the propagation story? Compute commitments prove enforceable and profitable, utilization stays high across generations, project DSCR remains comfortably above covenants, supplier inventories stay disciplined, lab gross margins and free cash flow improve, and old hardware finds valuable secondary workloads. In that world, the tower flexes without falling.
Chapter 25: The Dashboard
Any thesis worth taking seriously needs a scoreboard that can embarrass its author. The variables below connect our four recurring pictures: the intelligence factory, cost per useful task, the customer-return box and the capital tower.
The Investor Dashboard for Admitting We Were Wrong
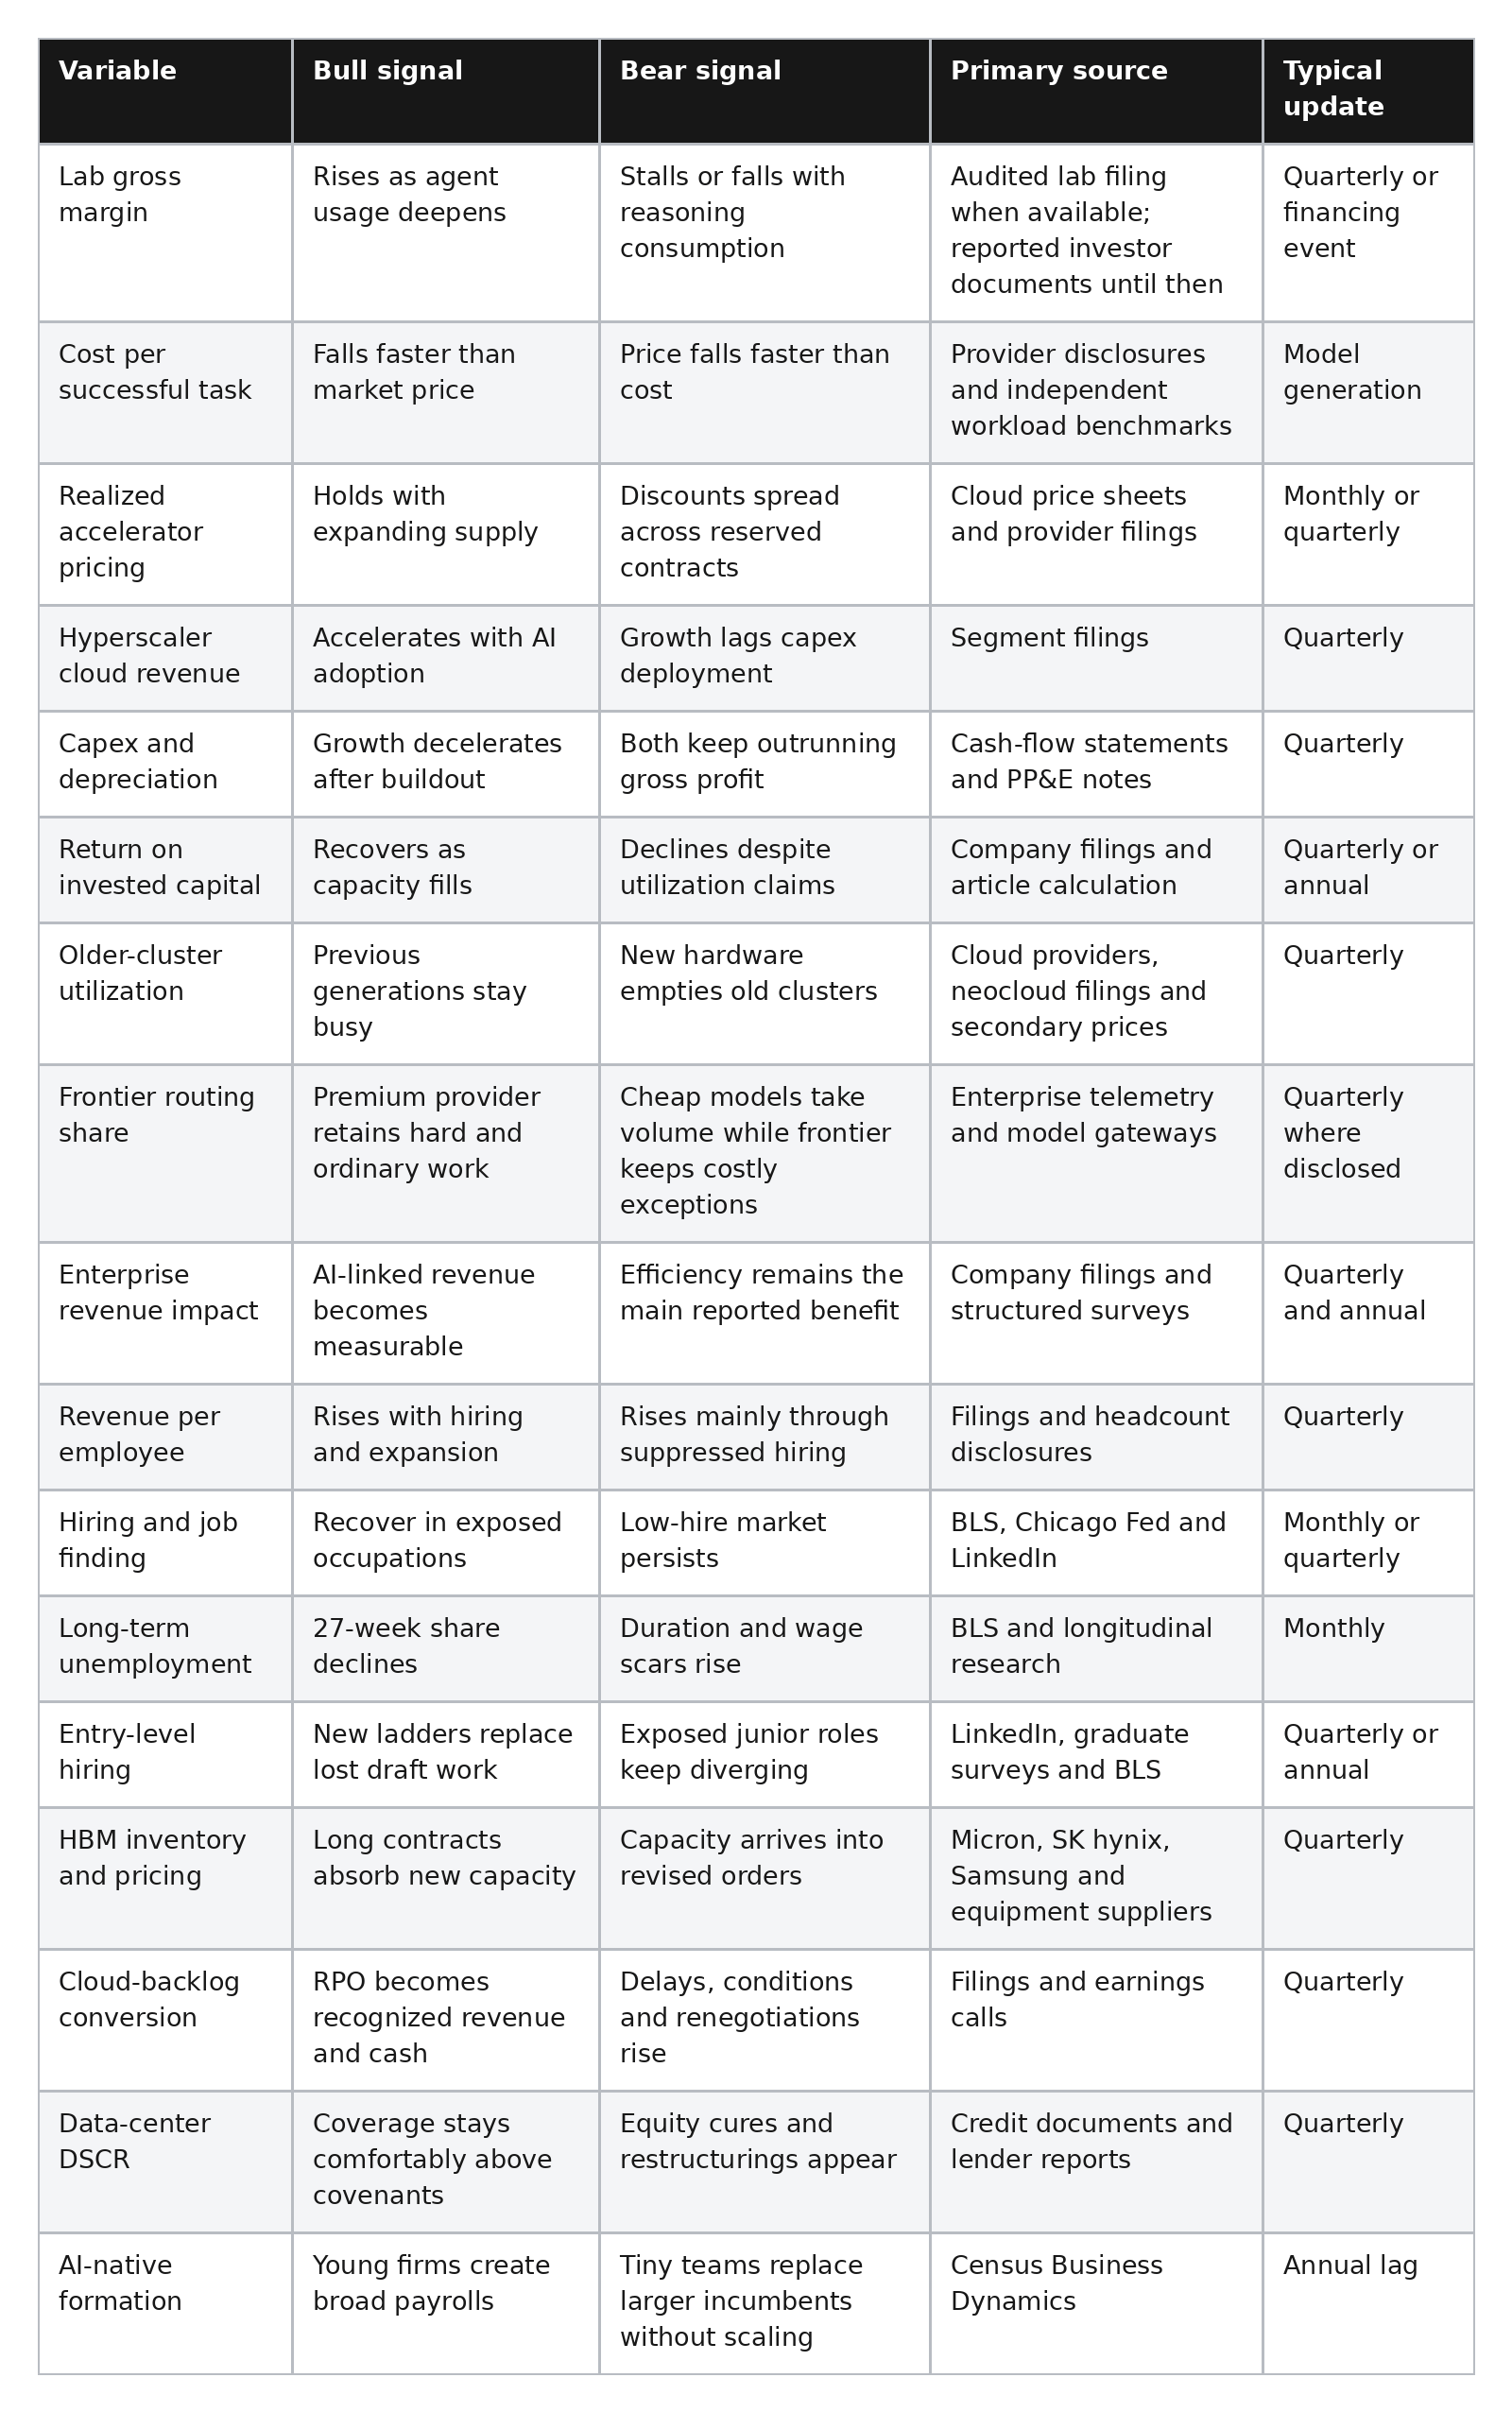
No single row settles the argument. Higher HBM prices are bullish for memory suppliers and bearish for lab input costs. Falling task cost is bullish for adoption and potentially bearish for old clusters. Rising revenue per employee can mean healthy expansion or missing jobs. The dashboard works because it forces the two factories to be evaluated together.
The thesis is wrong in its strongest form if lab gross margins rise, free cash flow turns durable, hyperscaler returns recover, old hardware retains useful demand, customer revenue expands with productive capacity and labor-market entry channels remain healthy. In that world the market financed an ugly but successful front-loaded buildout.
It’s right if capability and usage soar while price competition, depreciation, routing and weak customer revenue prevent the economic factory from earning the returns promised to every layer of capital.
Chapter 26: Why This Isn’t Dot-Com Again
Why Dot-AI Is Not Pets.com With Better GPUs
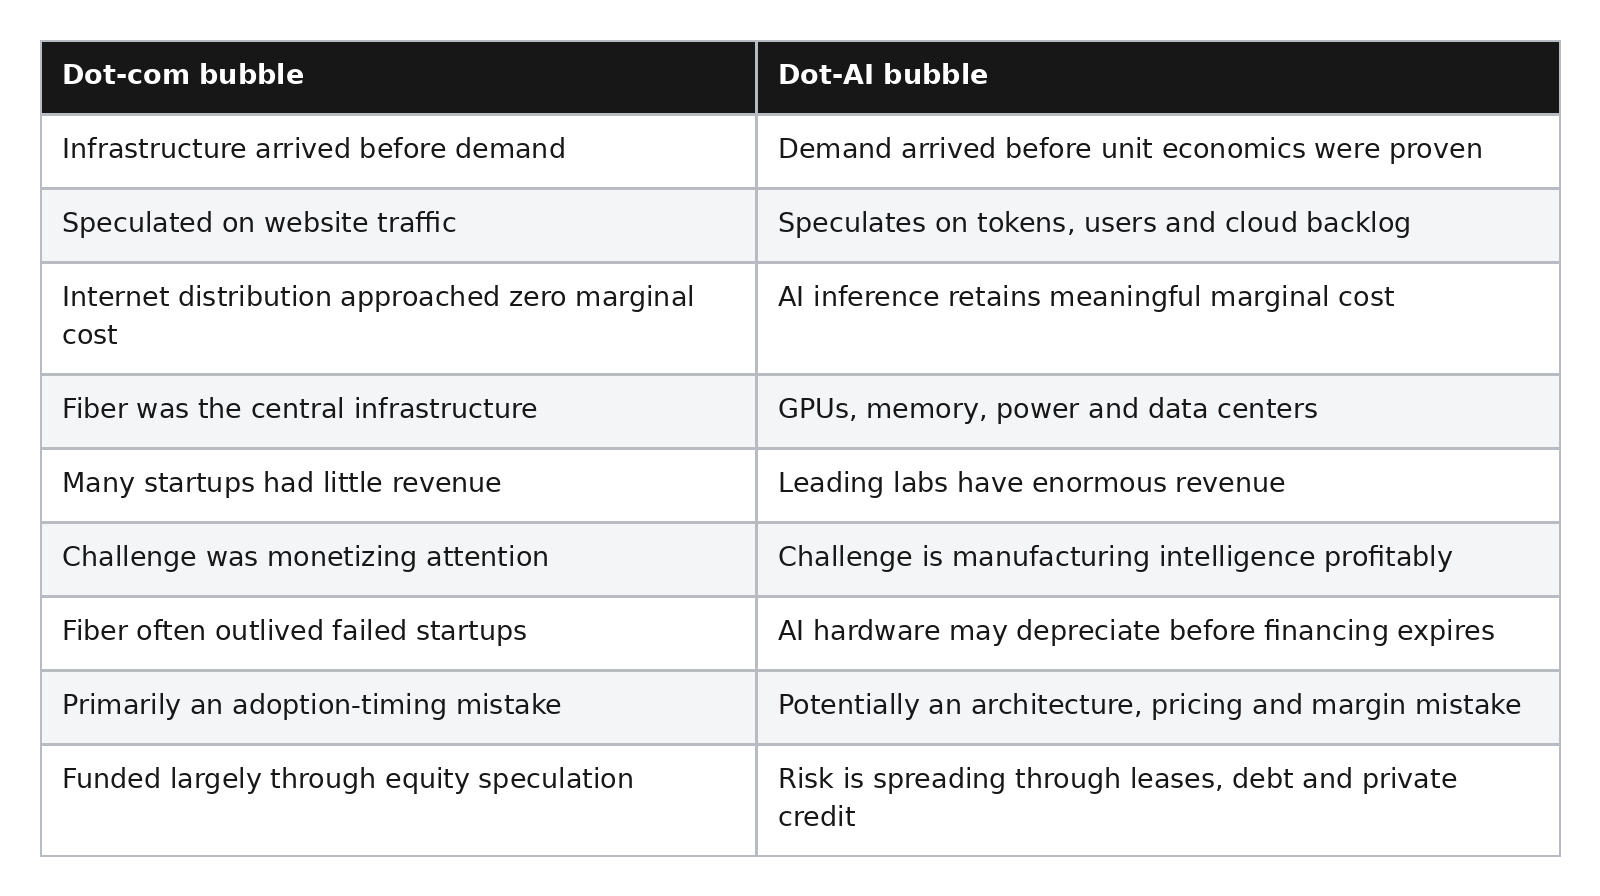
Dot-com investors were right about the internet and wrong about the timing, valuations and identity of the eventual winners.
Dot-AI investors may be right about machine intelligence and wrong about which models, infrastructure systems and pricing structures capture its value.
Epilogue: The Capital Stack Cannot Manufacture Its Own Customer
Okay, let’s come back to Atlas and the two factories. We have followed the same dollar from the enterprise through the laboratory and cloud provider into the racks, power contracts, debt service and replacement reserve. But we left one question sitting underneath the whole chain: where did the enterprise get the dollar?
At first, the answer can be boring. It came from an existing software budget. Then it came from investor capital allocated to experimentation. Then the CFO found savings. A contractor contract disappeared. Twenty planned hires became five. A support organization handled more tickets with fewer people. Those savings are real, and because avoided payroll recurs, they can fund a recurring AI bill for years.
They can’t compound without limit. Once the contractor is gone, that contract can’t be canceled again. Once the open roles disappear, management can’t avoid the same hires twice. Once a function has been compressed from 500 people to 350, extracting the next 150 is harder, riskier and eventually physically impossible. There is a floor below which the company stops being an impressively efficient organization and becomes three exhausted people supervising a haunted spreadsheet.
That’s the wall the article has been building toward. The AI capital stack is not priced merely for enterprises to replace a finite slice of payroll and maintain a stable model bill. Frontier-lab valuations, hyperscaler capex, data-center financing, HBM capacity, utility commitments and semiconductor road maps are priced for years of continued growth. Once cost removal reaches its practical ceiling, that growth needs net market expansion. Existing customers must make more real purchases. Previously priced-out customers must enter. Incumbents must create products that generate incremental sales. New AI-native companies must form and grow large enough to create both revenue and payroll. Nominal price increases can lift one seller’s revenue, but unless they reflect greater willingness to pay or are matched by income growth, they mostly move purchasing power around. Otherwise the same finite pool of enterprise revenue is simply being divided among fewer workers and more layers of capital.
There is no serious question that the physical factory can work. Build the data center, energize the racks, load the model and the thing will manufacture useful intelligence. Prompts enter. Tokens, code and actions come out. Customers use the output to write software, process documents, answer support questions and coordinate work. This is a real product solving real problems. The unresolved question is whether the economic factory creates enough net new customer revenue for everyone who has already submitted a claim on the value.
The lab has to collect enough revenue to cover inference, training and research. The cloud provider has to turn contracted capacity into margin after depreciation. Atlas has to service debt, fund replacement equipment and earn more than a mediocre yield on its equity. Semiconductor suppliers have to preserve enough pricing after capacity arrives. The enterprise customer has to turn additional productive capacity into revenue, higher prices or durable cost savings. Workers need routes into the occupations and companies that productivity creates, because workers remain customers. Finally, the customer’s customer has to put more money into the system.
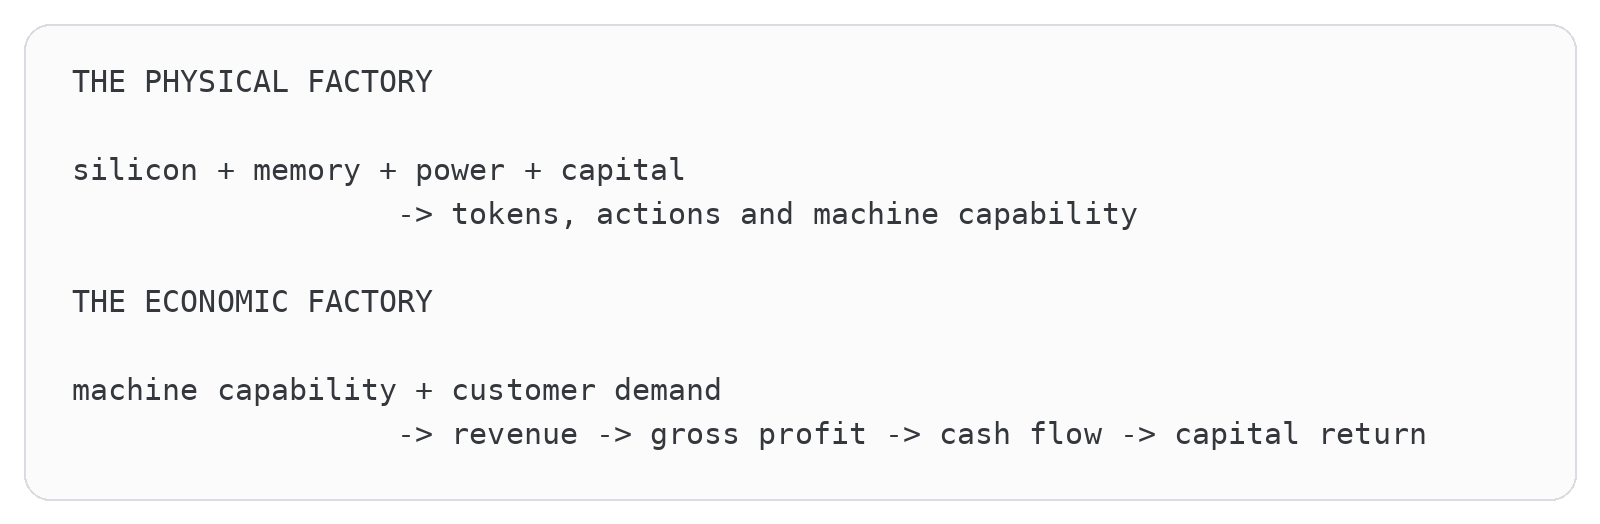
The racks can fill, the models can improve, the tokens can flow and customers can absolutely love the product before anyone proves that the capital behind the factory earned an acceptable return. Labor savings can make the first years look terrific. Margin expansion can validate the early enterprise budget. But a cost curve has a floor, while the capital stack expects a staircase.
That’s the dot-AI bubble. It isn’t a wager that artificial intelligence is fake. It’s a very large wager that success in the physical factory automatically creates success in the economic one, and that efficiency gains will become broad market expansion before the available savings run out.
Maybe they will. AI could make software, education, healthcare, legal services, research and company formation cheap enough to release an absurd amount of previously suppressed demand. Incumbents could sell much more. New firms could enter by the millions. Revenue growth could reabsorb labor, sustain consumption and send enough net new customer cash backward through every layer of Atlas. That is the complete bull case, and it is much stronger than simply saying token demand will rise.
But until those net new dollars appear, the boom is partly financing itself by converting existing payroll, existing budgets and investor capital into revenue for the AI stack. Those are legitimate sources of payment, and they can support adoption and substantial profits. They cannot, by themselves, justify every layer compounding forever. The physical factory can manufacture intelligence. The financial system can manufacture claims on future revenue. Neither can manufacture the final customer.
AI probably wins. The uncomfortable capitalist question is whether the rest of the market gets richer quickly enough to keep paying for the victory.